Fig. 2
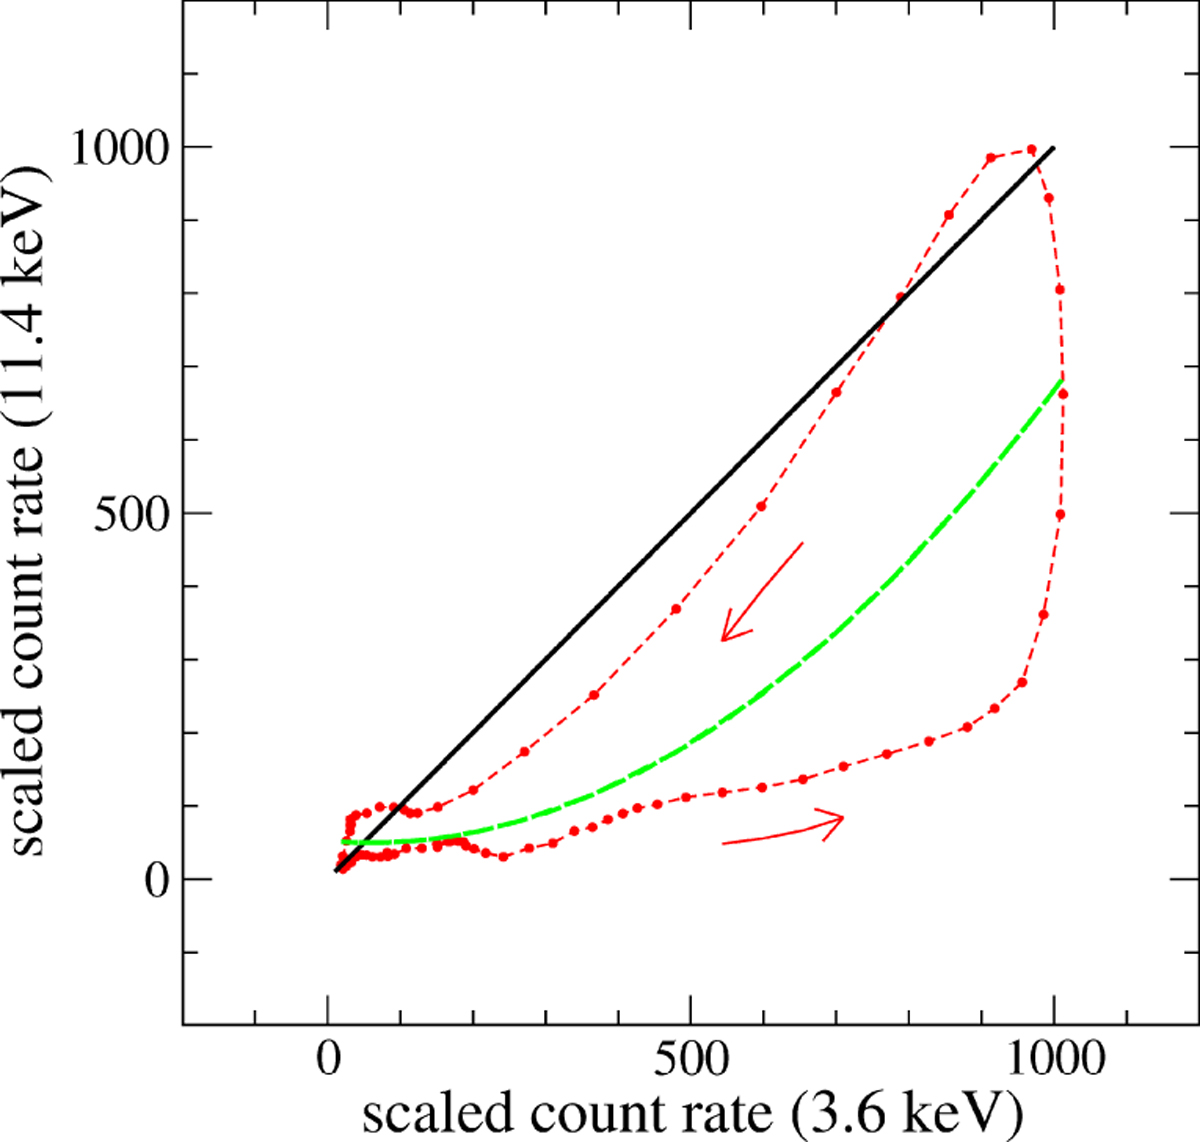
Two-energy plot for one of the GRS 1915+105 bursts reported in Fig. 1 after a smoothing to reduce the statistical noise. Photon count rates have been scaledto the same range from zero, corresponding to the minimum rate, to 1000 at the highest value. The bisecting black thick straight line is the locus of two coincident burst profiles; the dashed green line is the quadratic best fit to the data and the arrows indicate the time direction of the loop. The loop shape and the anticlockwise direction due to the HXD are clearly apparent.
Current usage metrics show cumulative count of Article Views (full-text article views including HTML views, PDF and ePub downloads, according to the available data) and Abstracts Views on Vision4Press platform.
Data correspond to usage on the plateform after 2015. The current usage metrics is available 48-96 hours after online publication and is updated daily on week days.
Initial download of the metrics may take a while.