Fig. 1
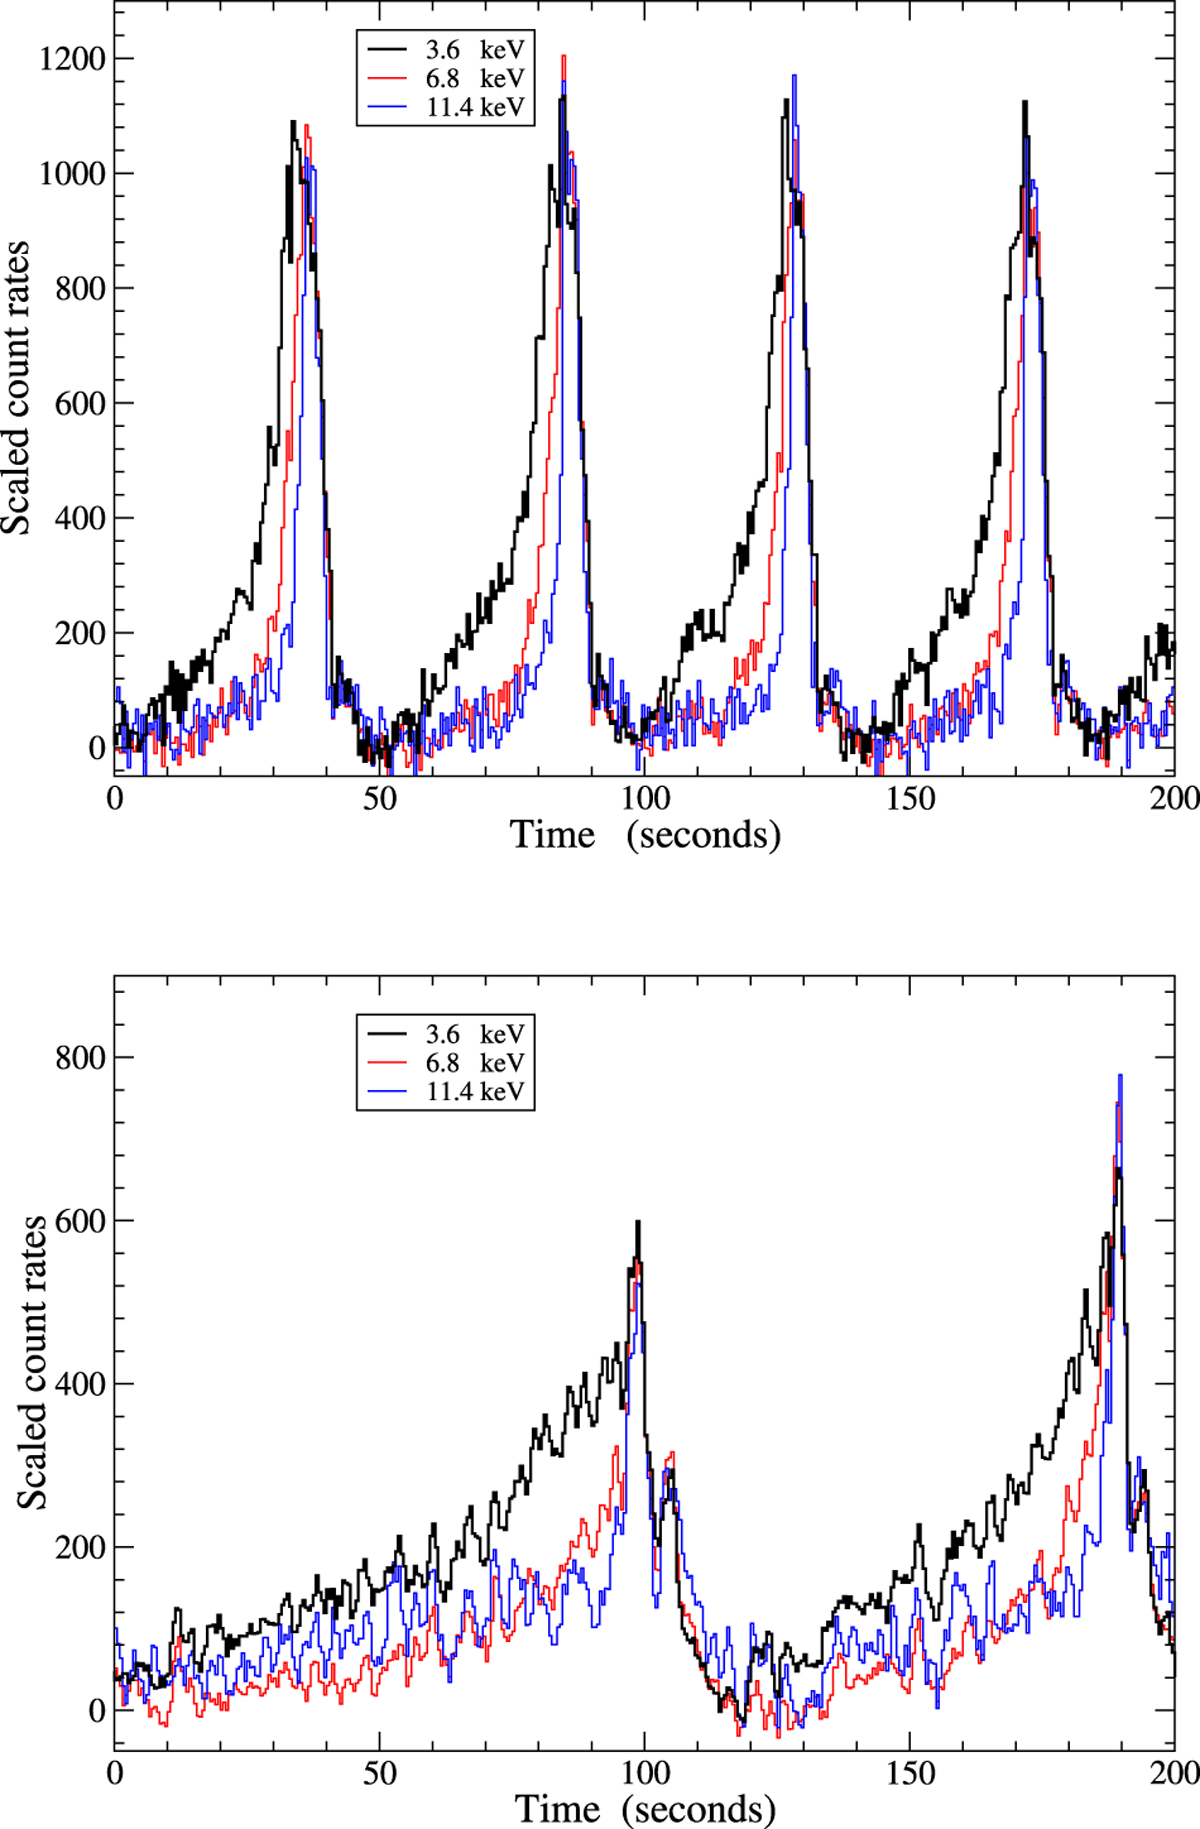
Two segments of RXTE/PCA light curves of GRS 1915+105 in the ρ variability class at three energies showing the HXD phenomenon and the dependence of the pulse width, w, upon energy. Data, after the subtraction of a constant level, are scaled to obtain comparable pulse heights. Upper panel: RXTE G-2a data; lower panel: G-1 data. In the latter data set the recurrence time of the bursts was more than twice longer than that in the former one. We note in both panels the variable duration and shape of individual bursts and in the upper one the small time delay of the peak maxima, particularly in the first and in the third burst.
Current usage metrics show cumulative count of Article Views (full-text article views including HTML views, PDF and ePub downloads, according to the available data) and Abstracts Views on Vision4Press platform.
Data correspond to usage on the plateform after 2015. The current usage metrics is available 48-96 hours after online publication and is updated daily on week days.
Initial download of the metrics may take a while.