Fig. 8
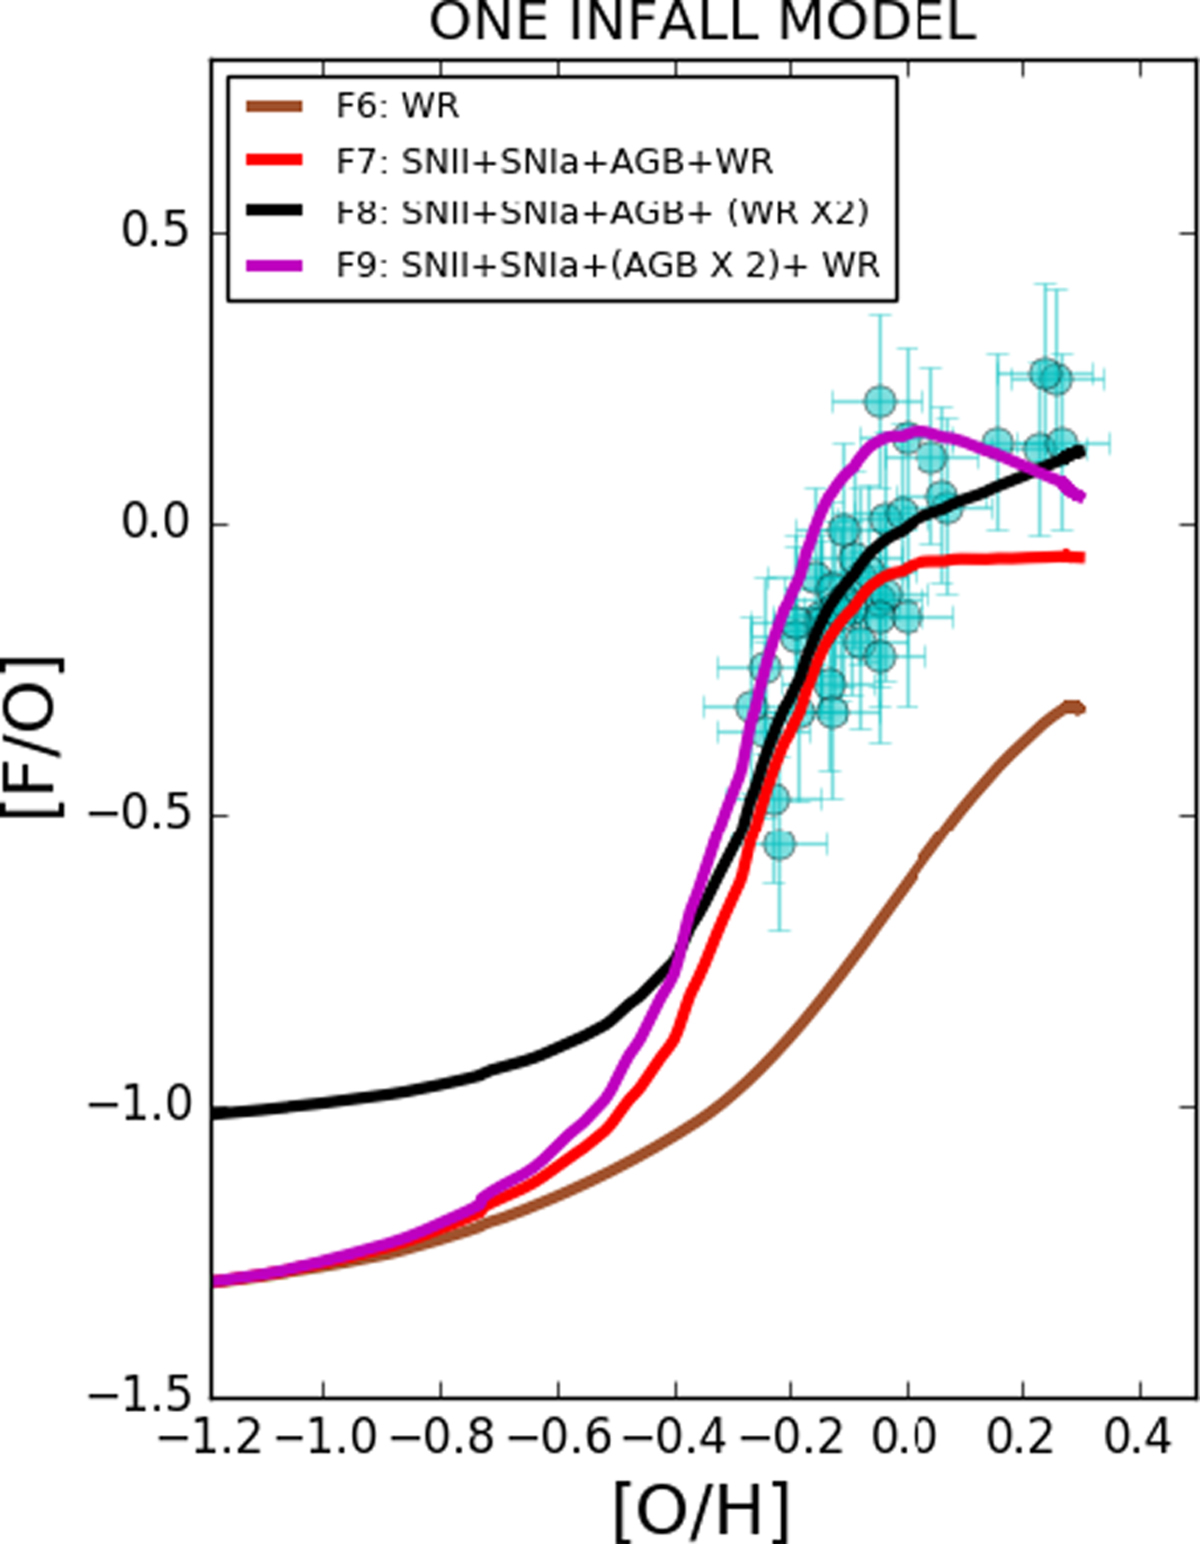
Abundance ratio [F/O] as a function of [O/H] in the solar neighborhood for the one-infall chemical evolution model adopting various prescriptions for the channels of fluorine production. The model F6, in which only the contribution for fluorine production is given by W-R stars, is indicated with the brown line. Model F7, in which we adopted the Romano et al. (2010) yield including W-R stars by Meynet & Arnould (2000), is shown with the red line. Model F8 (the same as model F7, but with the W-R fluorine yields multiplied by 2; see Table 1) is shown with the black line. Finally, models F9 (the same as model F7, but with the AGB fluorine yields multiplied by 2; see Table 1) is labeled with the magenta line. Observational data of Jönsson et al. (2017a) are indicated with cyan circles.
Current usage metrics show cumulative count of Article Views (full-text article views including HTML views, PDF and ePub downloads, according to the available data) and Abstracts Views on Vision4Press platform.
Data correspond to usage on the plateform after 2015. The current usage metrics is available 48-96 hours after online publication and is updated daily on week days.
Initial download of the metrics may take a while.