Fig. 7
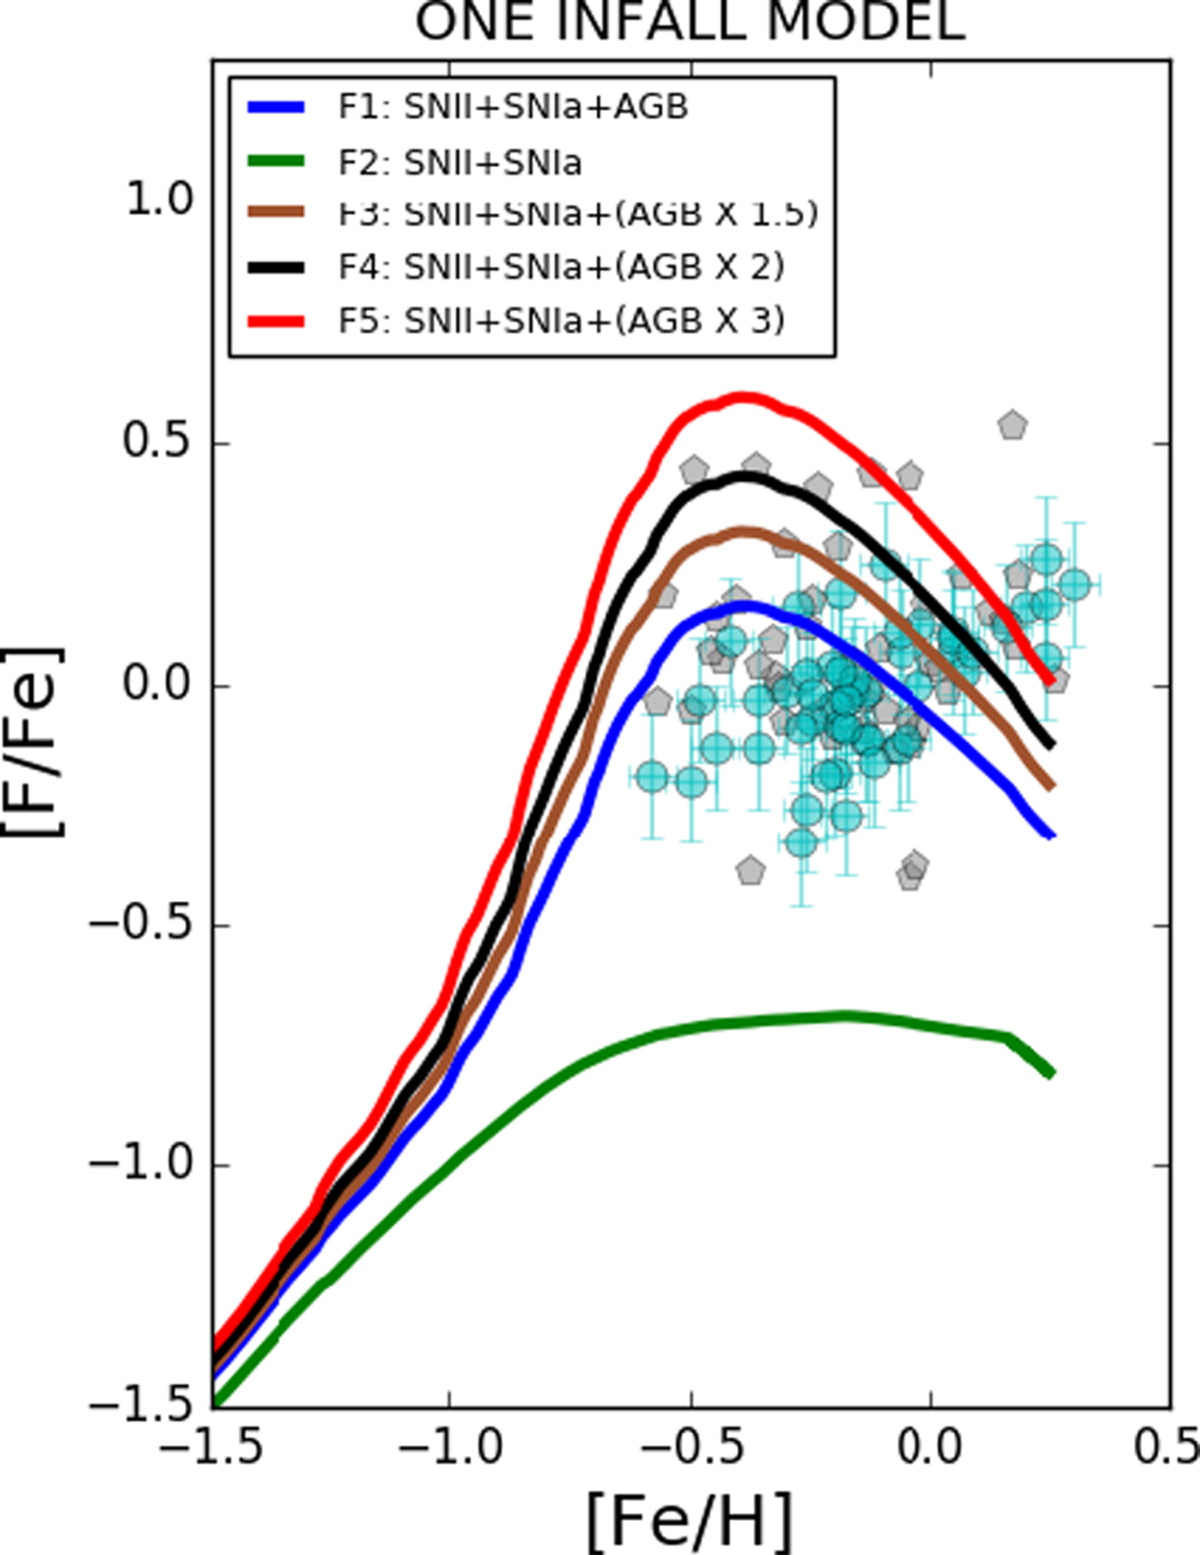
Abundance ratio [F/Fe] as a function of [Fe/H] in the solar neighborhood for the one-infall chemical evolution model. The model lines are those described in Fig. 6. Observational data of Jönsson et al. (2017a) are indicated with cyan circles, whereas the data taken by Pilachowski & Pace (2015) are presented with gray pentagons.
Current usage metrics show cumulative count of Article Views (full-text article views including HTML views, PDF and ePub downloads, according to the available data) and Abstracts Views on Vision4Press platform.
Data correspond to usage on the plateform after 2015. The current usage metrics is available 48-96 hours after online publication and is updated daily on week days.
Initial download of the metrics may take a while.