Fig. 5
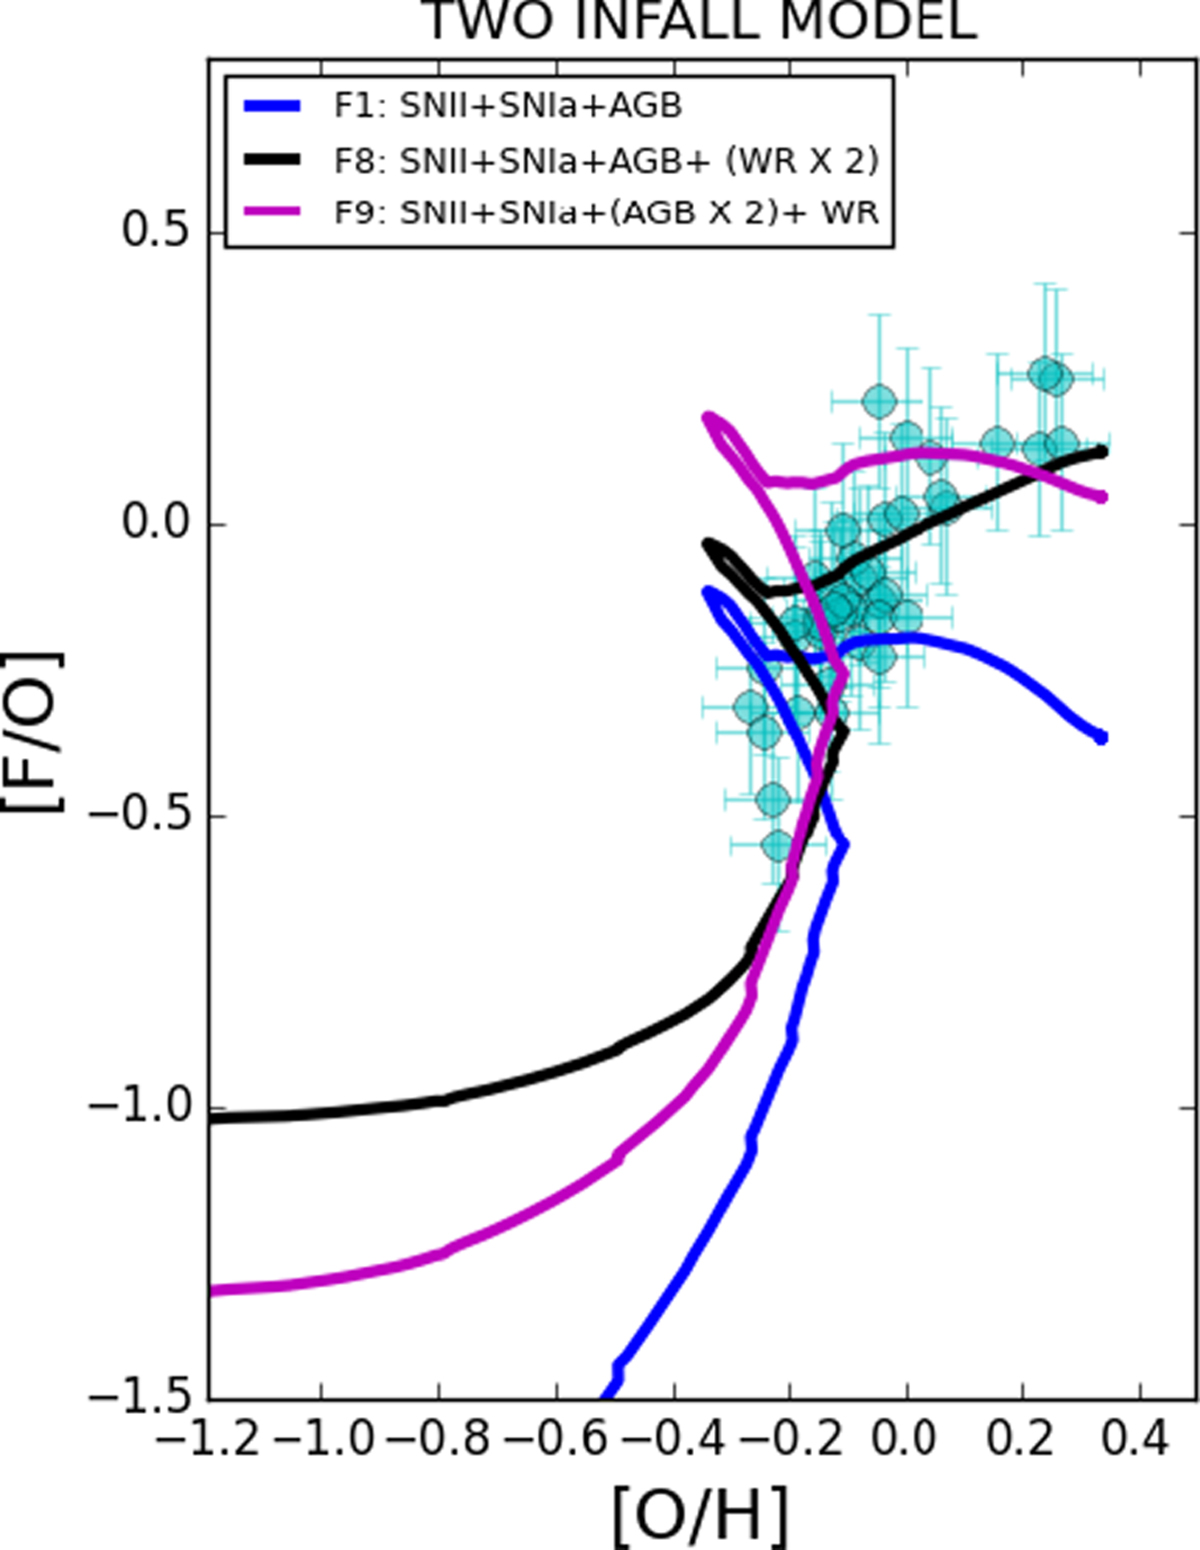
Abundance ratio [F/O] as a function of [O/H] in the solar neighborhood for the two-infall chemical evolution model. The blue line represents the model F1 of Table 1 in which fluorine is assumed to be produced by both AGB stars and SNe Ia and SNe II. The model similar to the F7 model but with the W-R yields multiplied by a factor of 2 is indicated with the black line. The magenta line represents the model F9 in which the contribution of SNe II and SNe Ia are considered along with W-R stars. In this model the AGB yields are multiplied by a factor of 2. Observational data of Jönsson et al. (2017a) are indicated with cyan circles.
Current usage metrics show cumulative count of Article Views (full-text article views including HTML views, PDF and ePub downloads, according to the available data) and Abstracts Views on Vision4Press platform.
Data correspond to usage on the plateform after 2015. The current usage metrics is available 48-96 hours after online publication and is updated daily on week days.
Initial download of the metrics may take a while.