Fig. 10
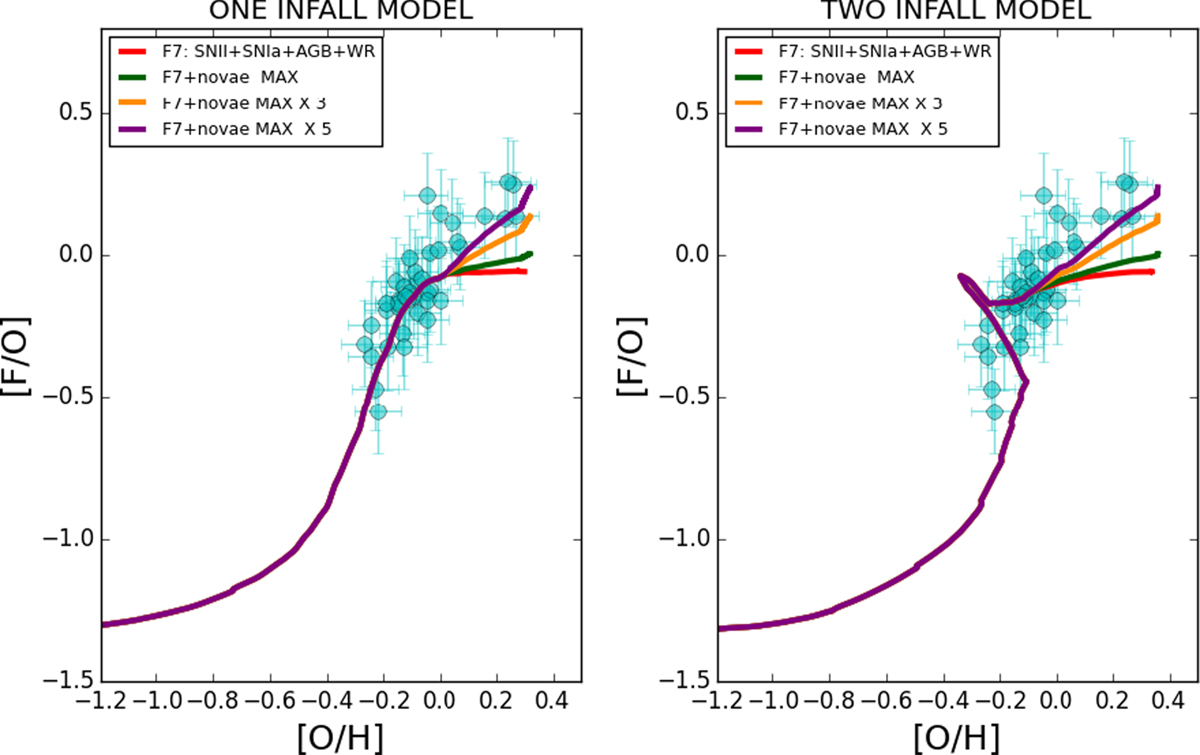
Abundance ratio [F/O] as a function of [O/H] in the solar neighborhood for the one-infall (left panel) and two-infall (right panel) chemical evolution models taking into account the effects of the novae. We consider for fluorine themaximum yield by José & Hernanz (1998; model ONe7) related to ONe white dwarf with masses of 1.35 M⊙. The blue line indicates the reference F7 model. The model with the “maximum” F novae yield is labeled with the pink line. Models with “maximum” F nova yield multiplied by factor of 5 and 10 are shown with orange and purple lines, respectively.
Current usage metrics show cumulative count of Article Views (full-text article views including HTML views, PDF and ePub downloads, according to the available data) and Abstracts Views on Vision4Press platform.
Data correspond to usage on the plateform after 2015. The current usage metrics is available 48-96 hours after online publication and is updated daily on week days.
Initial download of the metrics may take a while.