Fig. 1
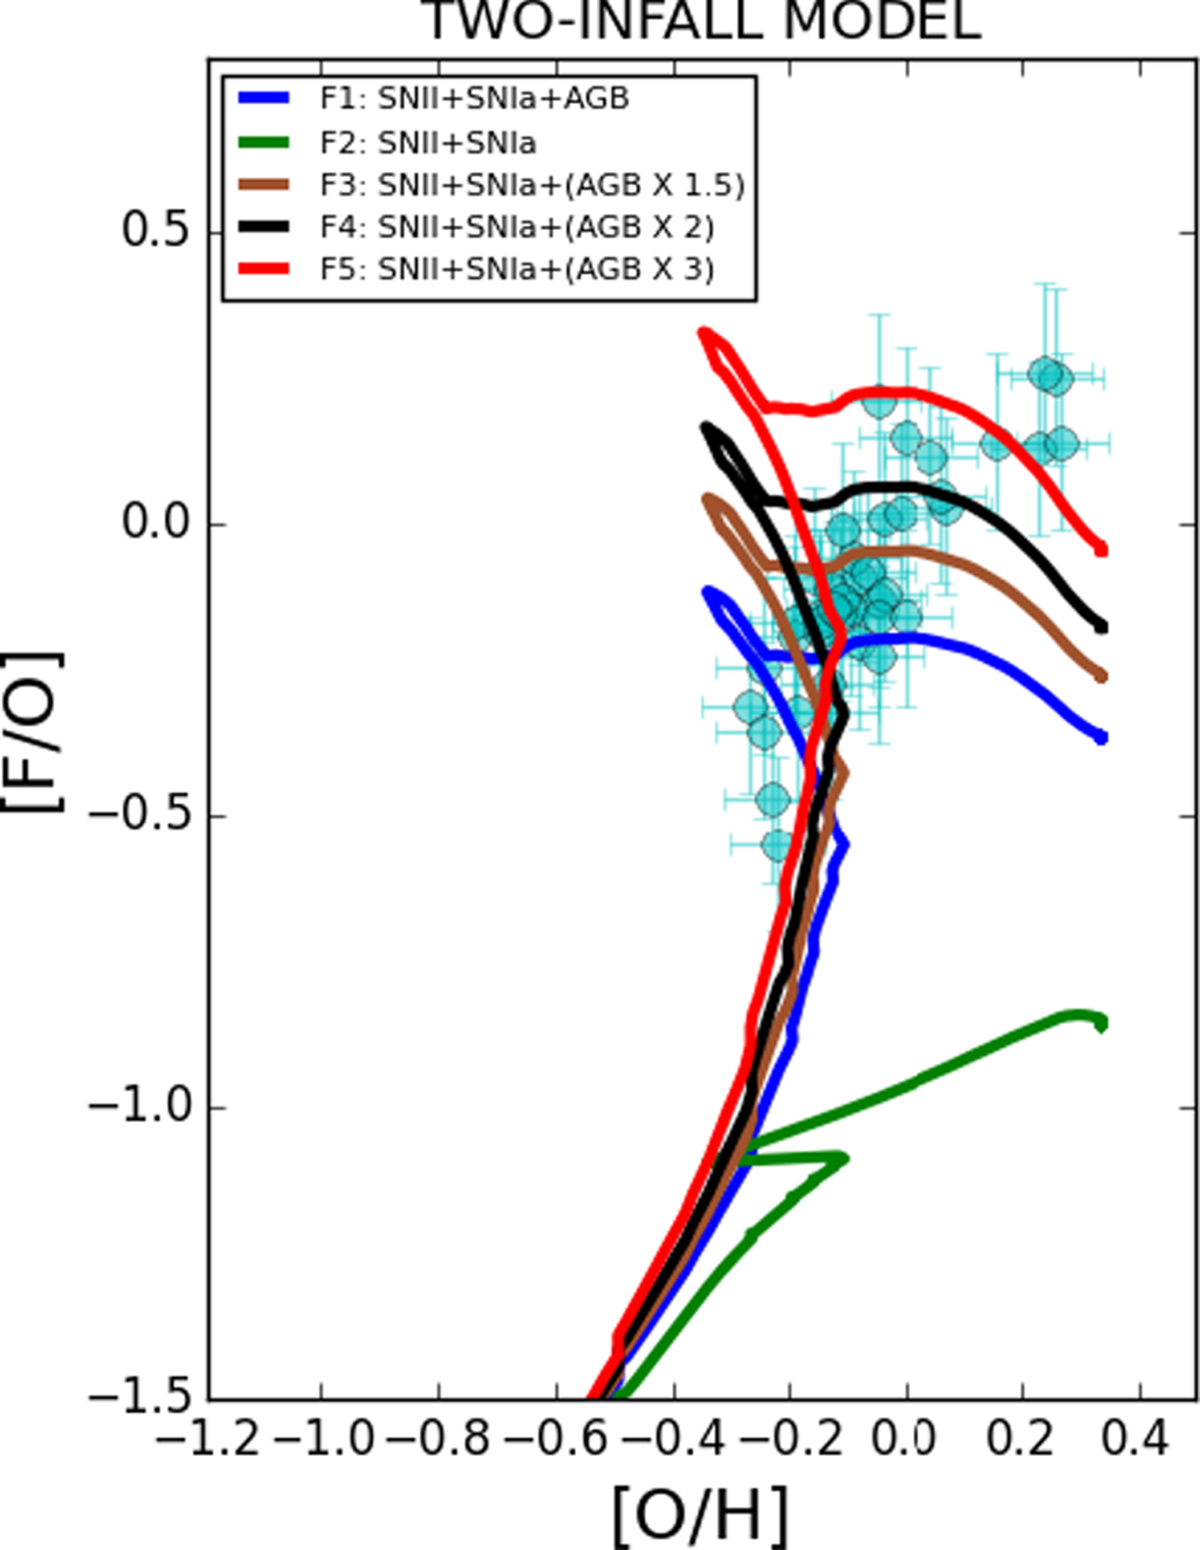
Abundance ratio [F/O] as a function of [O/H] in the solar neighborhood for the two-infall chemical evolution model adopting various prescriptions for the channels of the fluorine production. For oxygen we use the Romano et al. (2010; model 15) prescriptions. The blue line represents the model F1 of Table 2, where fluorine is assumed to be produced by both AGB stars, SNe Ia, and SNe II. The green line indicates the model F2 (contributions to fluorine production only from SNe Ia and SNe II). The models F3, F4, and F5 in which the AGB yields are multiplied by factors of 1.5, 2, and 3, respectively (along with SN Ia, SN II channels) are indicated with brown, black, and red lines. Observational data by Jönsson et al. (2017a) are indicated with cyan circles.
Current usage metrics show cumulative count of Article Views (full-text article views including HTML views, PDF and ePub downloads, according to the available data) and Abstracts Views on Vision4Press platform.
Data correspond to usage on the plateform after 2015. The current usage metrics is available 48-96 hours after online publication and is updated daily on week days.
Initial download of the metrics may take a while.