Fig. 7
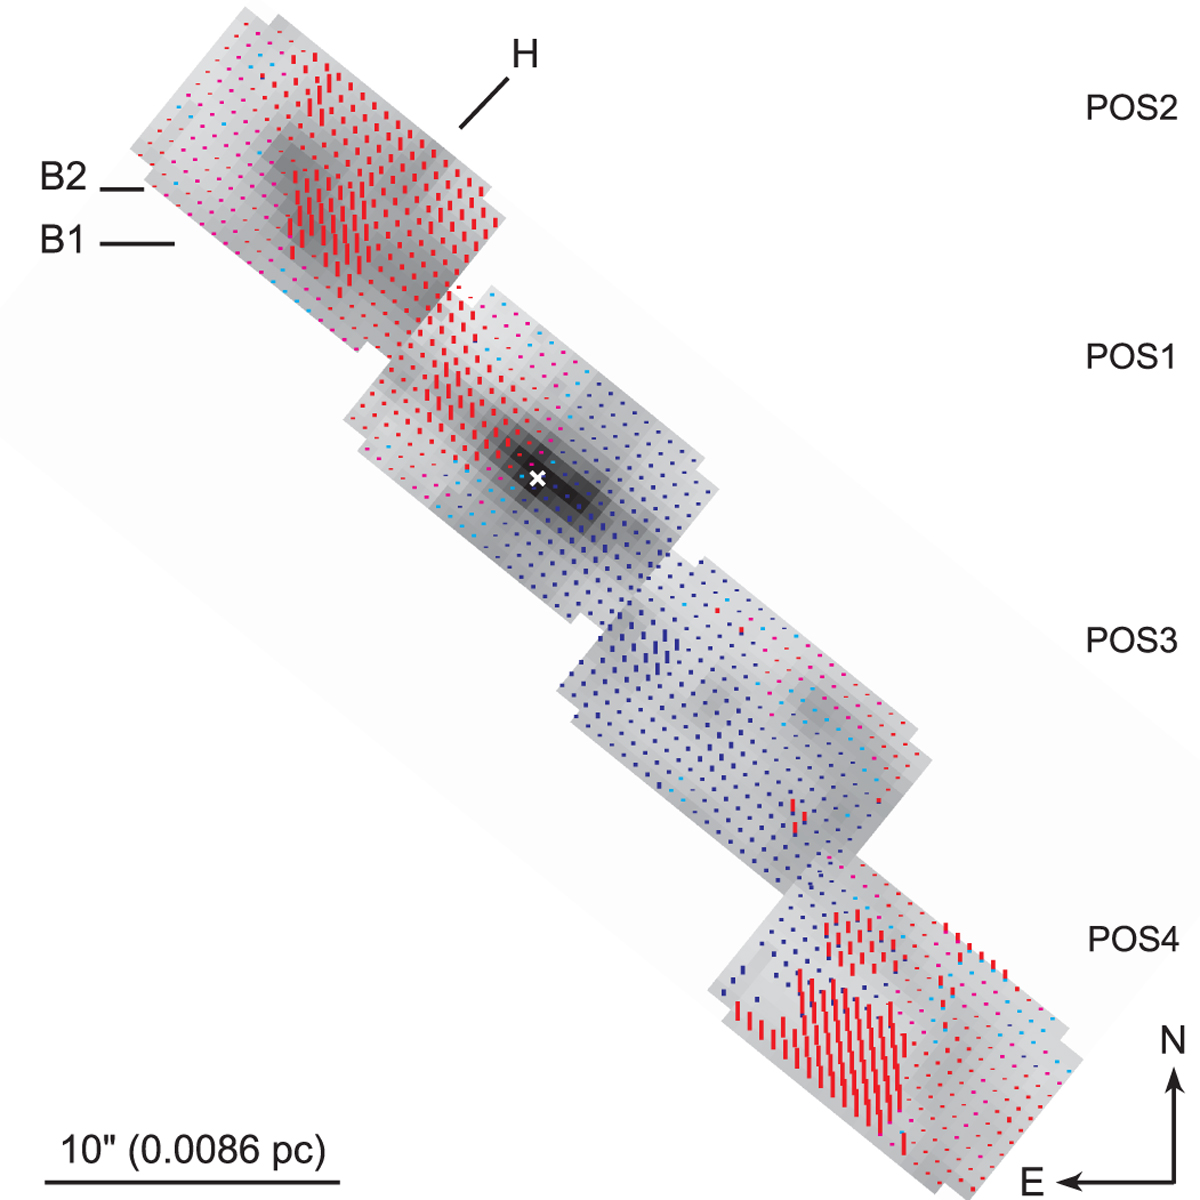
Radial velocities of the emission peaks, superimposed onto a grey-scale representation of the reconstructed [O III] image from the IFU data. The FOV = 40″ × 40″. Radial velocities are indicated by lines, whose colour indicates if emission is blue- or red-shifted, and whose length is proportional to the absolute value of the velocity. Cyan and pink lines represent blue shifted velocities smaller than −5 km s−1 and redshifted smaller than +5 km s−1respectively. The length of the cyan and pink lines are constant because otherwise they would be too small to be visible. The white X-point marks the position of the central star. The distance used for the linear size is taken from this work: 178 pc.
Current usage metrics show cumulative count of Article Views (full-text article views including HTML views, PDF and ePub downloads, according to the available data) and Abstracts Views on Vision4Press platform.
Data correspond to usage on the plateform after 2015. The current usage metrics is available 48-96 hours after online publication and is updated daily on week days.
Initial download of the metrics may take a while.