Free Access
Fig. 7
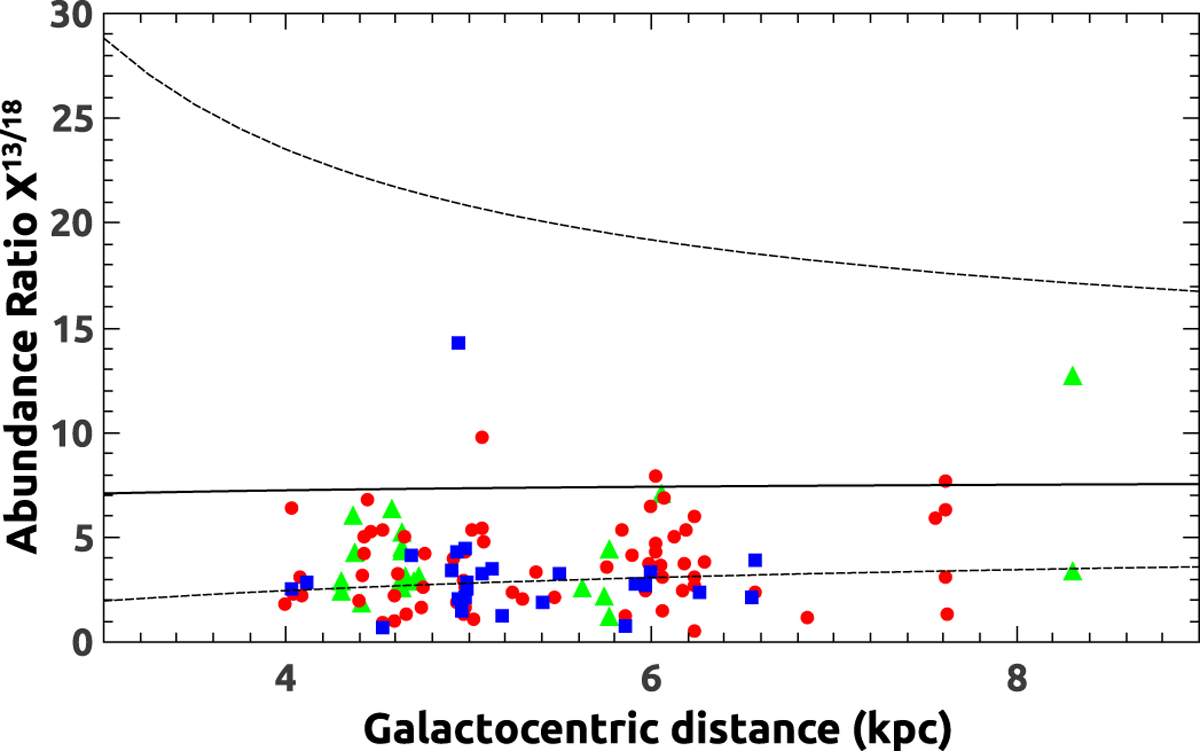
Abundance ratio X13∕18 vs. galactocentric distance. The continuous black curve is the plot of the 13CO/C18O abundance ratio from Wilson & Rood (1994) (Eq. (10)). Dashed curves are the result of plotting this equation considering the errors bars.
Current usage metrics show cumulative count of Article Views (full-text article views including HTML views, PDF and ePub downloads, according to the available data) and Abstracts Views on Vision4Press platform.
Data correspond to usage on the plateform after 2015. The current usage metrics is available 48-96 hours after online publication and is updated daily on week days.
Initial download of the metrics may take a while.