Free Access
Fig. 6
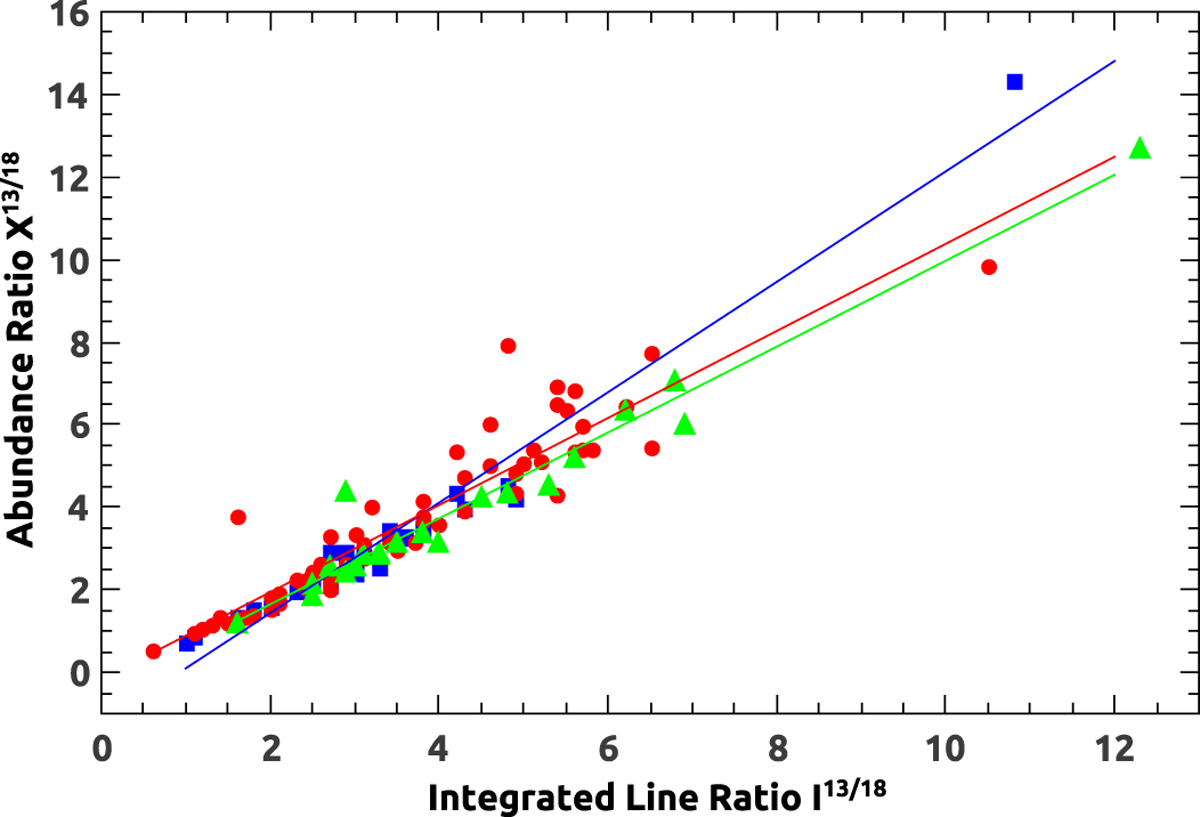
Abundance ratio X13∕18 vs. integrated line ratio I13∕18. YSOs, HII regions, and diffuse HII regions are represented with blue squares, red circles, and green triangles, respectively. Linear fittings to each set of data for the whole sample are displayed.
Current usage metrics show cumulative count of Article Views (full-text article views including HTML views, PDF and ePub downloads, according to the available data) and Abstracts Views on Vision4Press platform.
Data correspond to usage on the plateform after 2015. The current usage metrics is available 48-96 hours after online publication and is updated daily on week days.
Initial download of the metrics may take a while.