Fig. 6
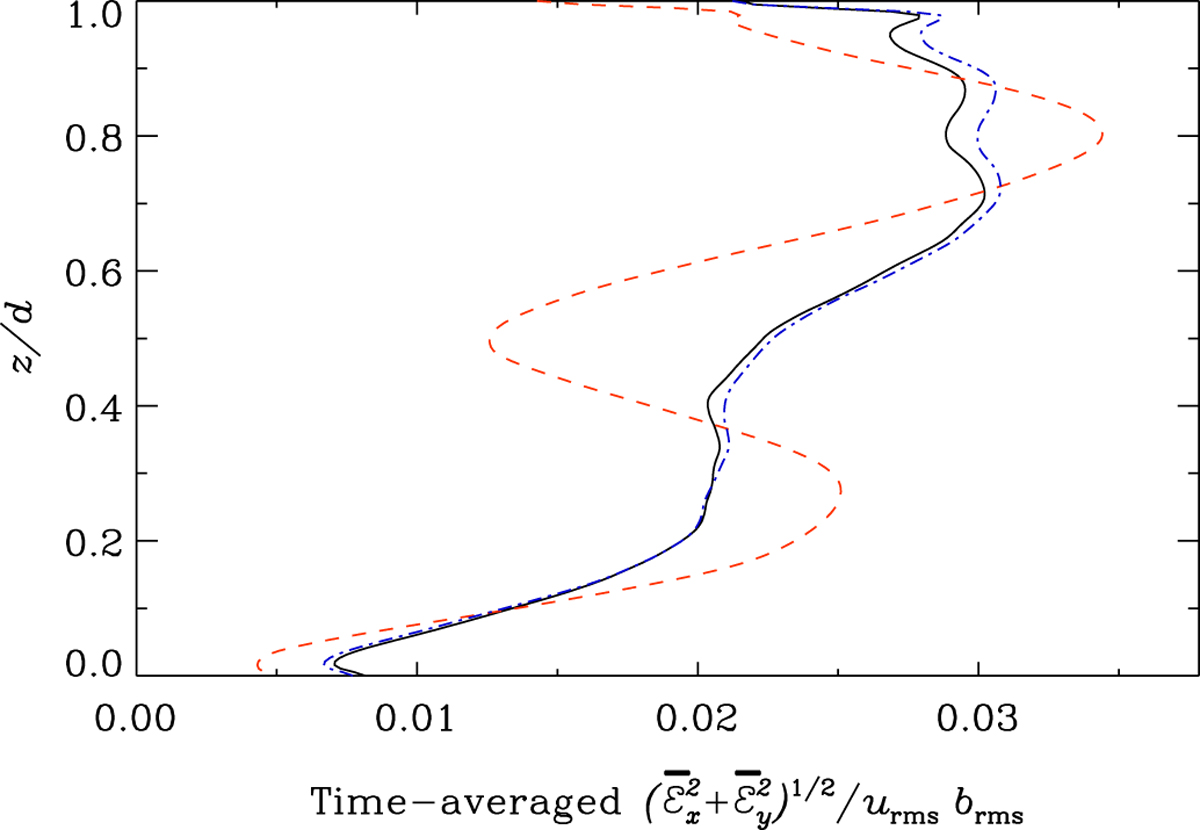
Time-averaged ![]() , normalised by urmsbrms, as a functionof z (solid black curve). The blue dash-dotted curve (very close to the black line) shows the same quantity but having removed low horizontal wavenumber components (k∕k1 ≤ 2) from the flow before calculating
, normalised by urmsbrms, as a functionof z (solid black curve). The blue dash-dotted curve (very close to the black line) shows the same quantity but having removed low horizontal wavenumber components (k∕k1 ≤ 2) from the flow before calculating ![]() and
and ![]() . The red dashed curve shows the effects of removing more Fourier modes (k∕k1 ≤ 6).
. The red dashed curve shows the effects of removing more Fourier modes (k∕k1 ≤ 6).
Current usage metrics show cumulative count of Article Views (full-text article views including HTML views, PDF and ePub downloads, according to the available data) and Abstracts Views on Vision4Press platform.
Data correspond to usage on the plateform after 2015. The current usage metrics is available 48-96 hours after online publication and is updated daily on week days.
Initial download of the metrics may take a while.