Fig. 6
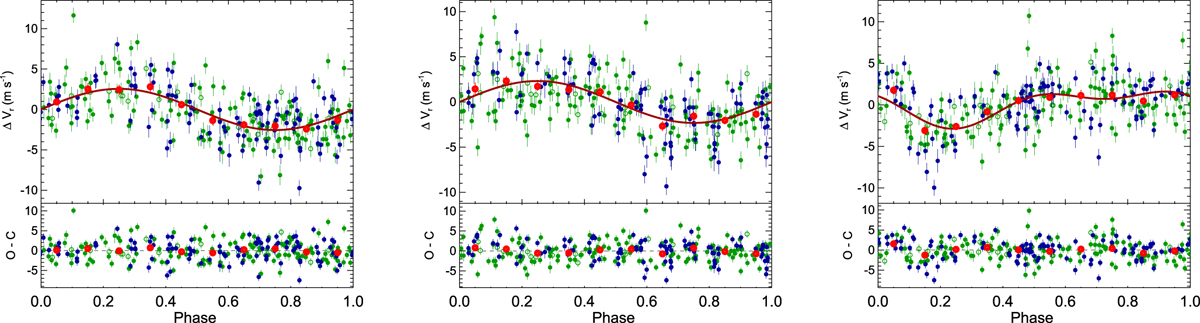
Phase-folded curve of the RV time-series using the 16.82 d signal (left panel), the 6.49 d signal (centre panel), and the 35.74 d signal (right panel). Green filled dots show HARPS pre-upgrade data, green empty dots show HARPS post-upgrade data, and blue filled dots show HARPS-N data. Red empty dots are the same points binned in phase with a bin size of 0.1. The error bar of a given bin is estimated using the weighted standard deviation of the binned measurements divided by the square root of the number of measurements included in this bin. The dark red line shows the best fit to the data using double sinusoidals at P and P/2 for all the signals. In each case, the contribution of the other two detected signals has been subtracted.
Current usage metrics show cumulative count of Article Views (full-text article views including HTML views, PDF and ePub downloads, according to the available data) and Abstracts Views on Vision4Press platform.
Data correspond to usage on the plateform after 2015. The current usage metrics is available 48-96 hours after online publication and is updated daily on week days.
Initial download of the metrics may take a while.