Fig. G.1
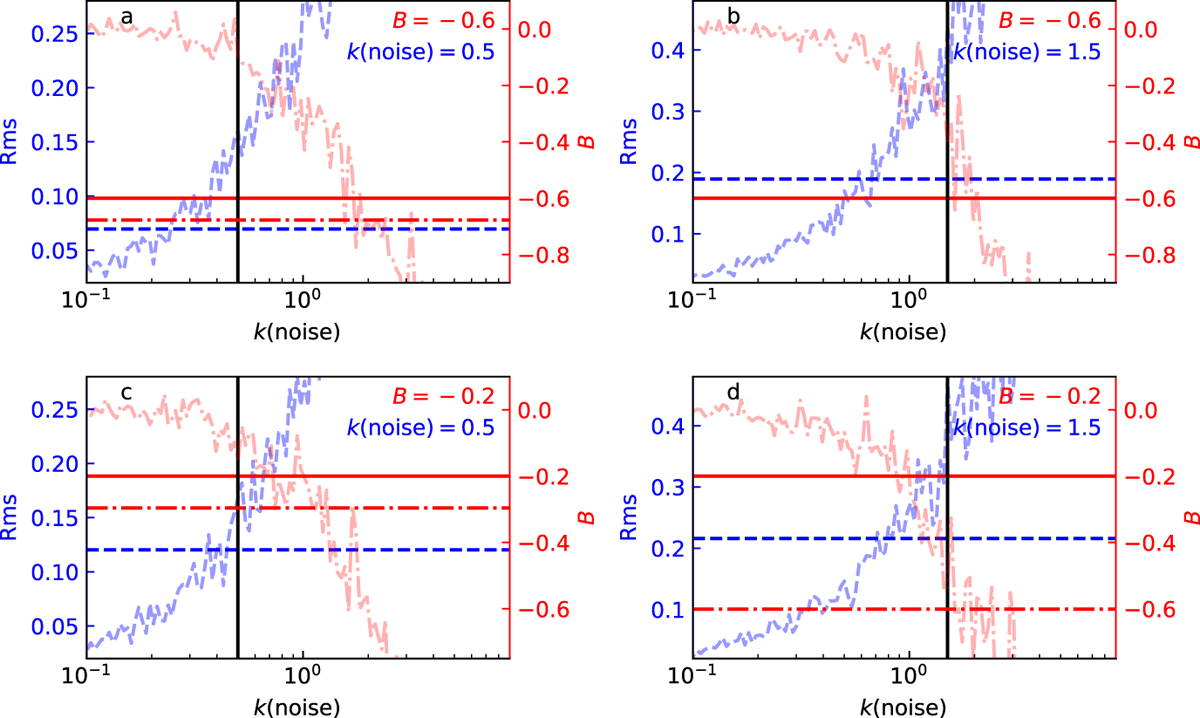
Analysis of a set of synthetic observations that follow an intrinsic β(T) ∝TB relation. The parameters B and k (noise) of the input simulation are given in the frames and are indicated by solid vertical and horizontal lines. The horizontal dot-dashed and dashed lines correspond to the values of B and the β rms dispersion, respectively, which are estimated from one realisation of synthetic observations. The other curves show B (dot-dashedred line) and the rms dispersion (blue dashed line) from simulations as a function of the noise scaling k (noise).
Current usage metrics show cumulative count of Article Views (full-text article views including HTML views, PDF and ePub downloads, according to the available data) and Abstracts Views on Vision4Press platform.
Data correspond to usage on the plateform after 2015. The current usage metrics is available 48-96 hours after online publication and is updated daily on week days.
Initial download of the metrics may take a while.