Fig. 5
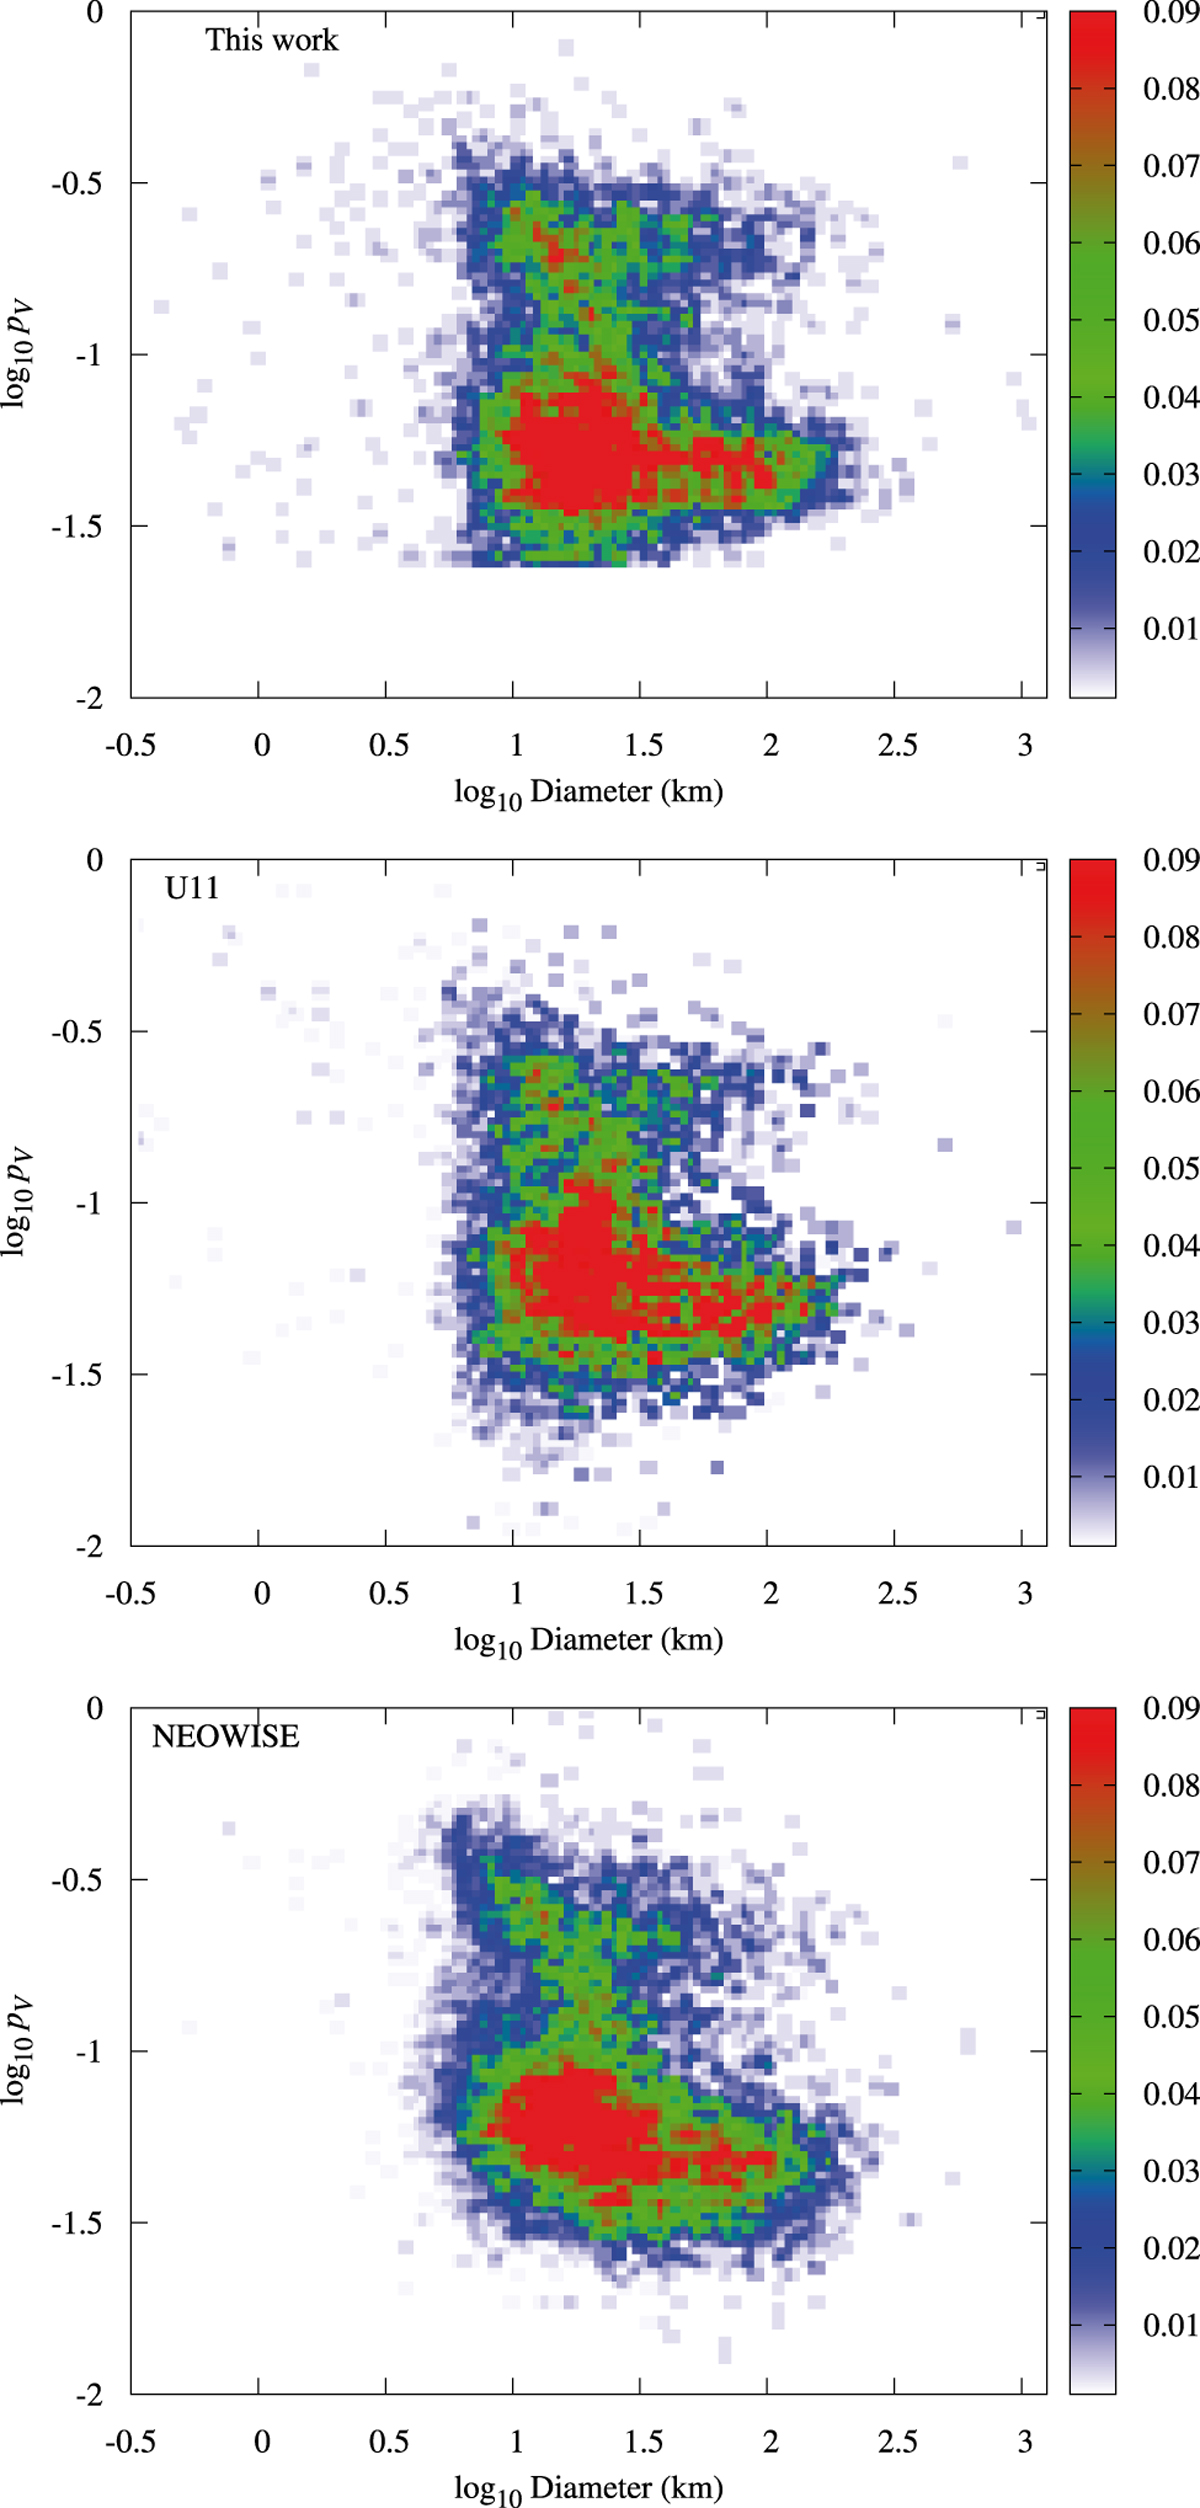
Visible geometric albedos versus diameters derived here from the AKARI IRC All-sky survey fluxes (top panel), those of U11H13 (middle panel), and those computed for all our objects that were reported in the tables by Mainzer et al. (2016). The colour code is proportional to the number of points in each bin normalised to the total number of points, which is different in each case.
Current usage metrics show cumulative count of Article Views (full-text article views including HTML views, PDF and ePub downloads, according to the available data) and Abstracts Views on Vision4Press platform.
Data correspond to usage on the plateform after 2015. The current usage metrics is available 48-96 hours after online publication and is updated daily on week days.
Initial download of the metrics may take a while.