Free Access
Fig. 5
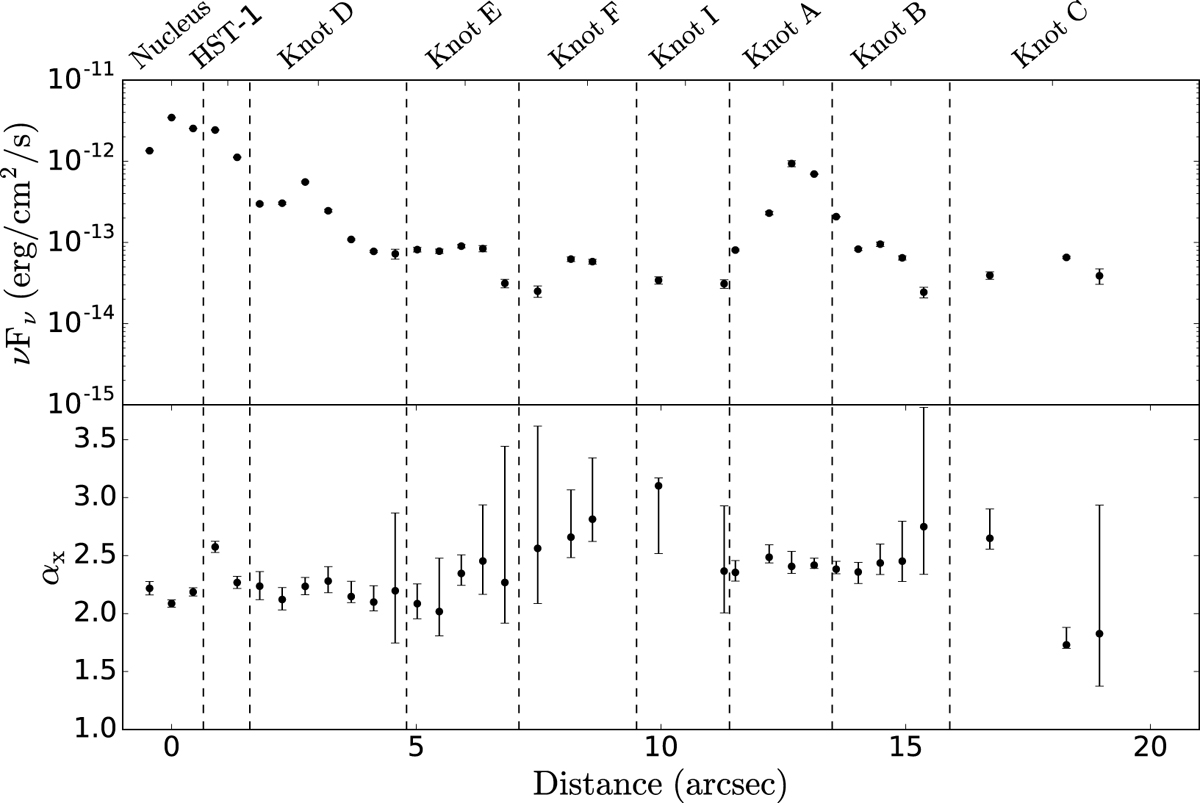
Flux density (top panel) and power-law photon index (bottom panel) in the X-ray 0.3–7 keV band along the jet. The source regions are separated by the dashed lines. For this representation all observations with frame time 0.4 s are used for the nucleus, while for HST-1 only “HST-1 L” data are employed.
Current usage metrics show cumulative count of Article Views (full-text article views including HTML views, PDF and ePub downloads, according to the available data) and Abstracts Views on Vision4Press platform.
Data correspond to usage on the plateform after 2015. The current usage metrics is available 48-96 hours after online publication and is updated daily on week days.
Initial download of the metrics may take a while.