Fig. 4
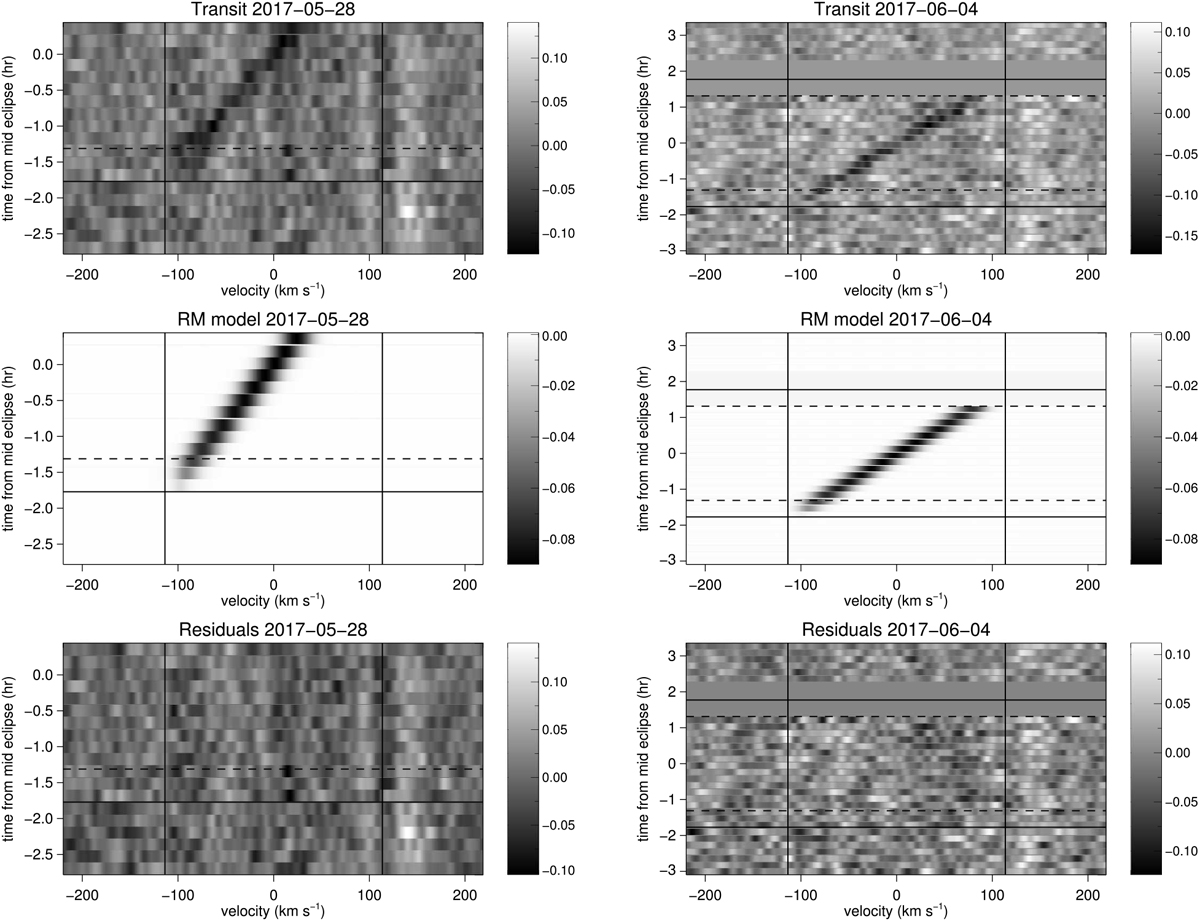
Rossiter–McLauglin measurements of MASCARA-2 during the transits occurring in the nights of May 28 (left column) and June 4 (right column). On June 4 one hour around egress was missed since the star was too close to zenith to be observed with SONG. In each panel the solid horizontal lines indicate the beginning of ingress and the end of egress and the dashed horizontal lines indicate the end of ingress and the beginning of egress. The vertical lines indicate the width of the best-fit rotational broadening profile. Shown in the rows are the observed CCFs after subtracting the average line profile and revealing the planet shadow (top), the best-fit model to the observations (middle) and the residuals of the observations after subtracting the best-fit model (bottom).
Current usage metrics show cumulative count of Article Views (full-text article views including HTML views, PDF and ePub downloads, according to the available data) and Abstracts Views on Vision4Press platform.
Data correspond to usage on the plateform after 2015. The current usage metrics is available 48-96 hours after online publication and is updated daily on week days.
Initial download of the metrics may take a while.