Fig. 2
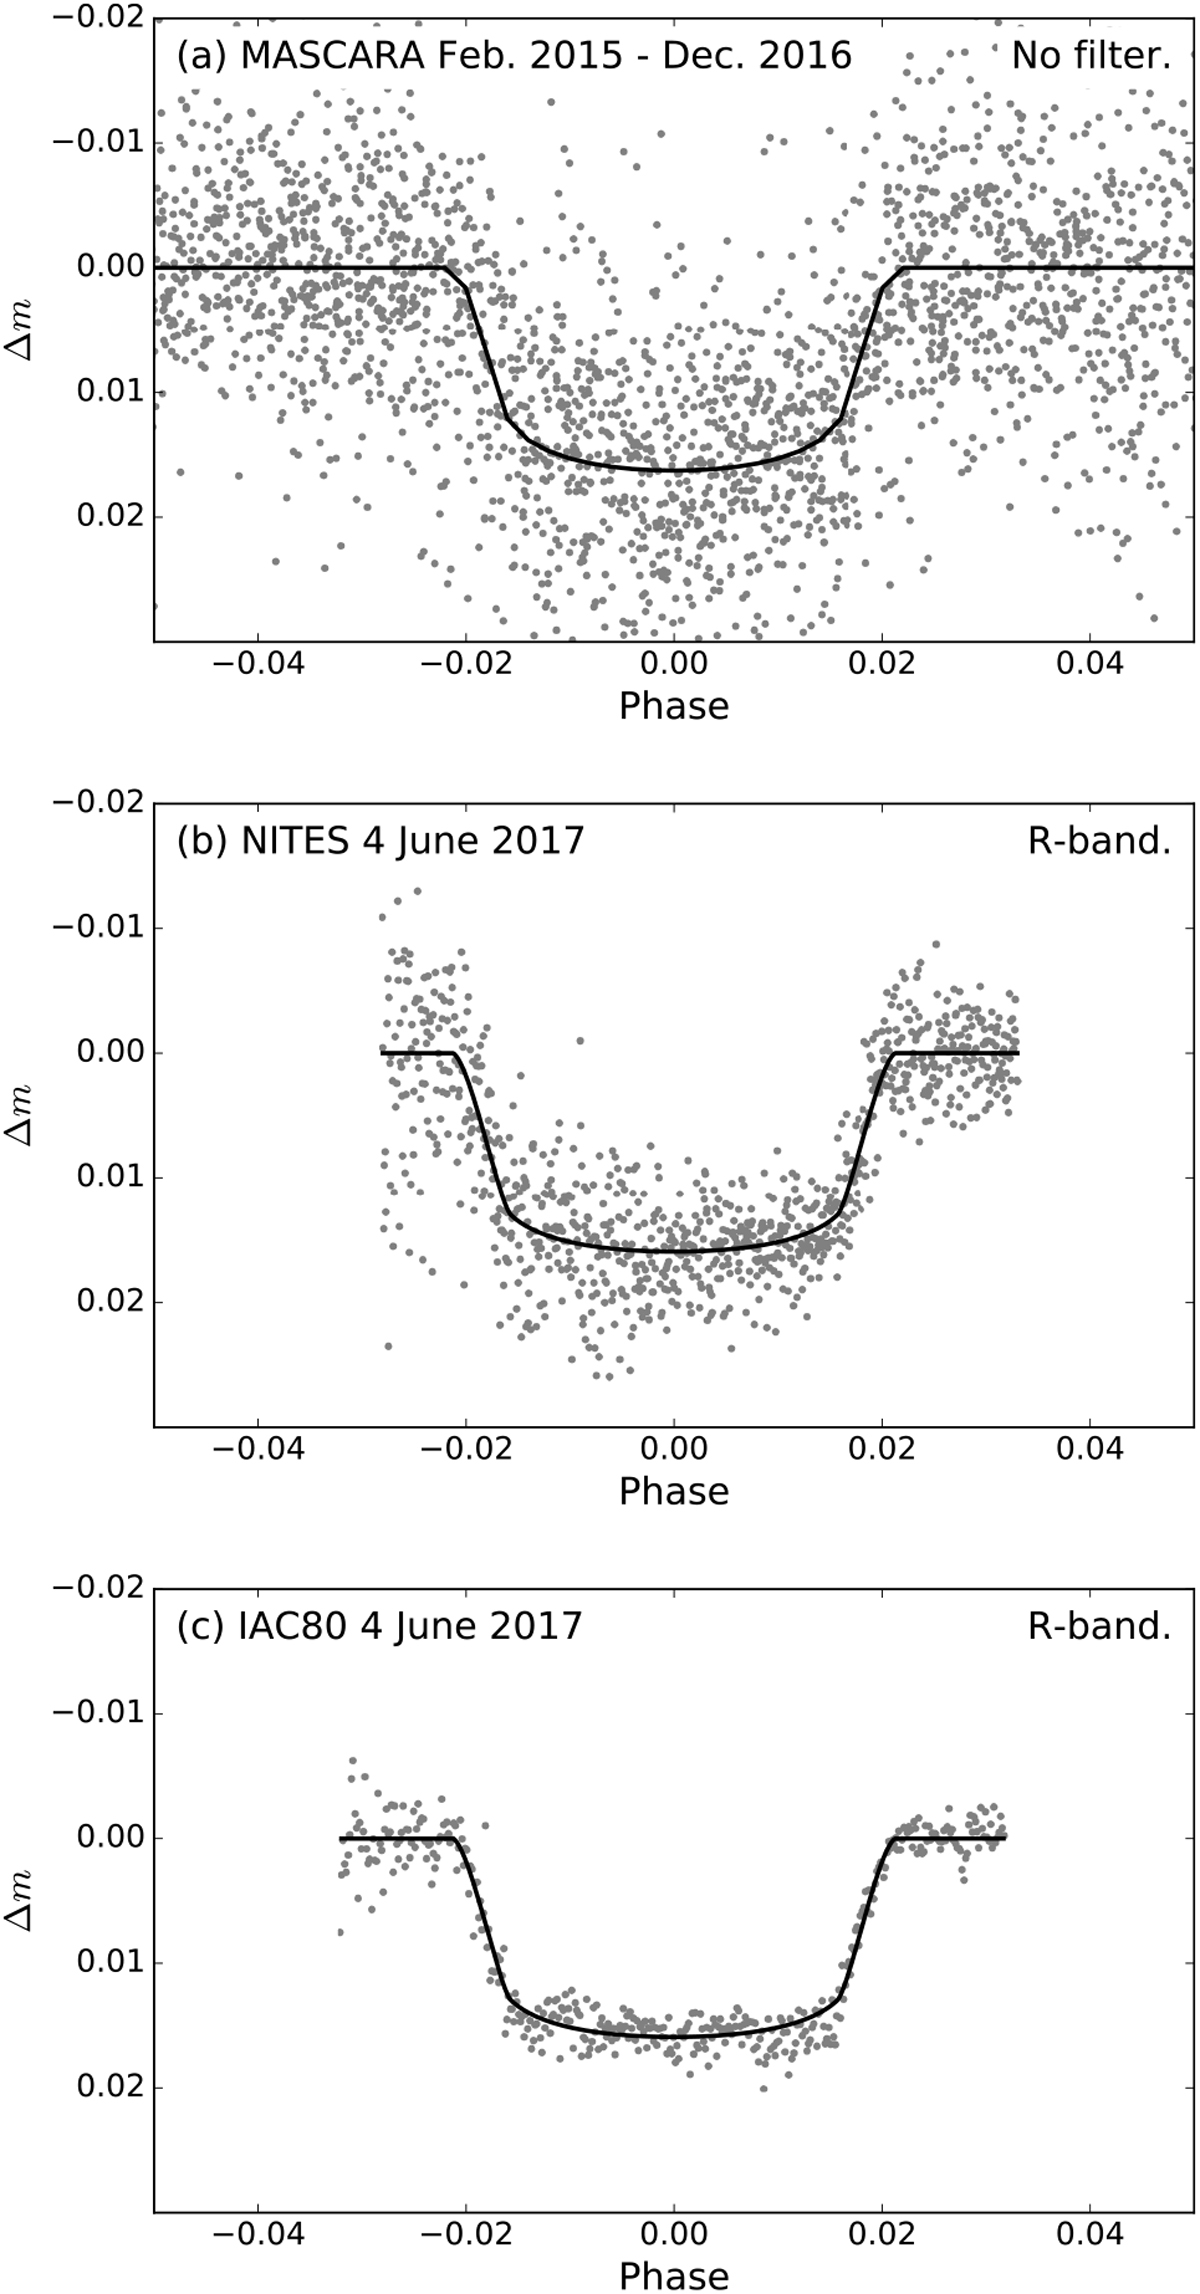
Photometric data (grey points) after subtraction of the best-fit baseline model, and best-fit transit model (black line) for MASCARA-2 b. a) The calibrated MASCARA data obtained from February 2015 to December 2016. b) The NITES dataobtained during the night of the 4 June 2017. c) The IAC80 data obtained during the night of the 4 June 2017.
Current usage metrics show cumulative count of Article Views (full-text article views including HTML views, PDF and ePub downloads, according to the available data) and Abstracts Views on Vision4Press platform.
Data correspond to usage on the plateform after 2015. The current usage metrics is available 48-96 hours after online publication and is updated daily on week days.
Initial download of the metrics may take a while.