Fig. 1
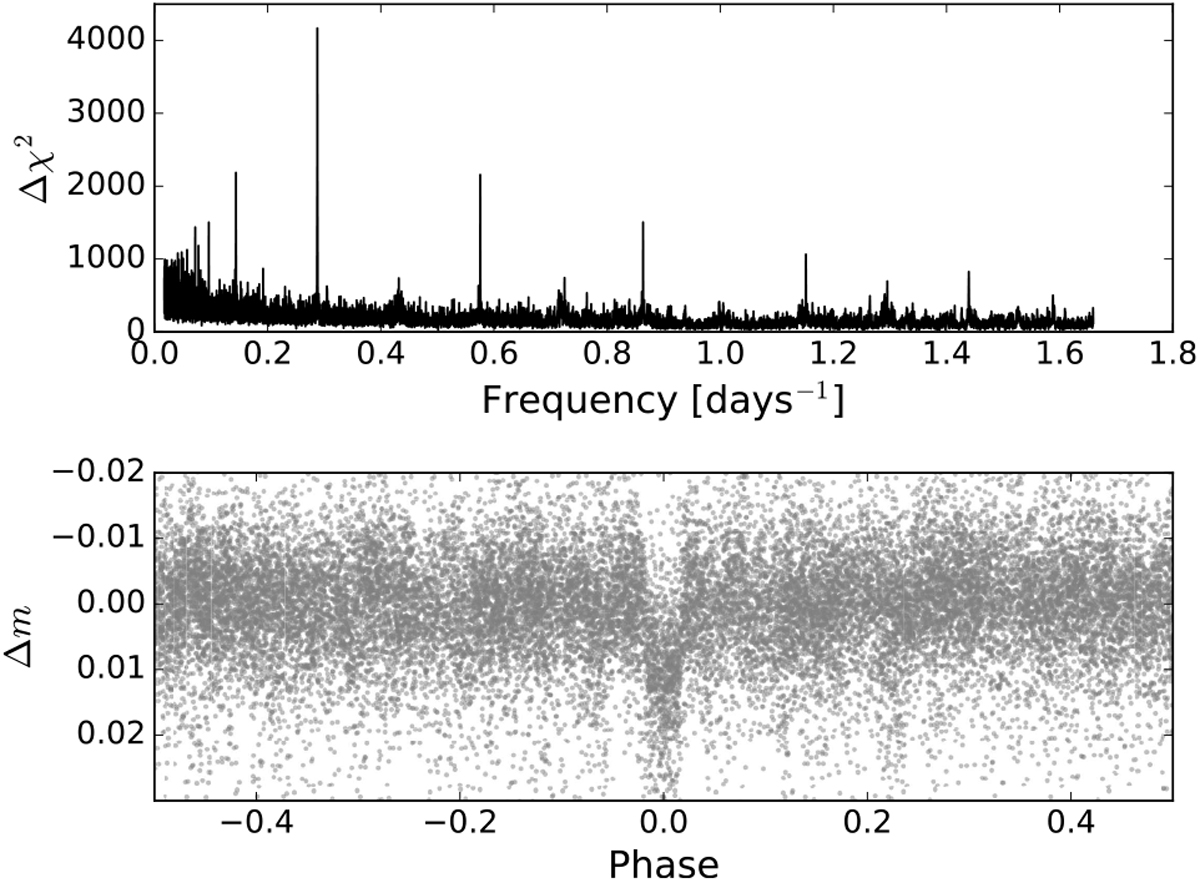
Discovery data of MASCARA-2 b. Top panel: BLS periodogram of the calibrated MASCARA light curve obtained between February 2015 and December 2016. The peak in the periodogram is located at a frequency of 0.288 days−1. Bottom panel: the calibrated MASCARA data, consisting of 24 309 points after binning to a cadence of 320 s. The data has been phase-folded to a period of 3.474 days, corresponding to the peak in the periodogram.
Current usage metrics show cumulative count of Article Views (full-text article views including HTML views, PDF and ePub downloads, according to the available data) and Abstracts Views on Vision4Press platform.
Data correspond to usage on the plateform after 2015. The current usage metrics is available 48-96 hours after online publication and is updated daily on week days.
Initial download of the metrics may take a while.