Free Access
Fig. 8
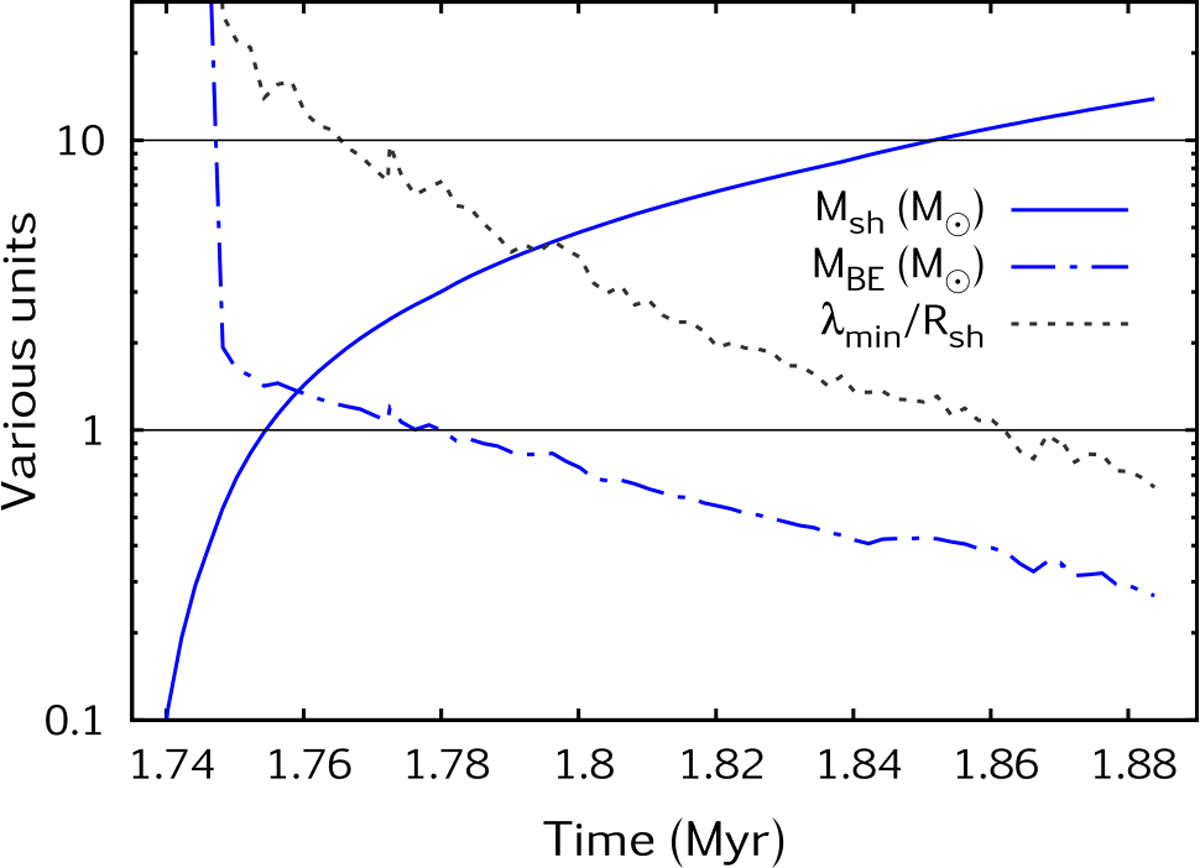
Shell mass, Msh, as a function of time since the star’s birth (solid blue line), compared to the Bonner-Ebert mass MBE at the densest point in the shell (dot-dashed blue line). The dashed black line shows the minimum unstable wavelength in units of the shell radius.
Current usage metrics show cumulative count of Article Views (full-text article views including HTML views, PDF and ePub downloads, according to the available data) and Abstracts Views on Vision4Press platform.
Data correspond to usage on the plateform after 2015. The current usage metrics is available 48-96 hours after online publication and is updated daily on week days.
Initial download of the metrics may take a while.