Fig. 3
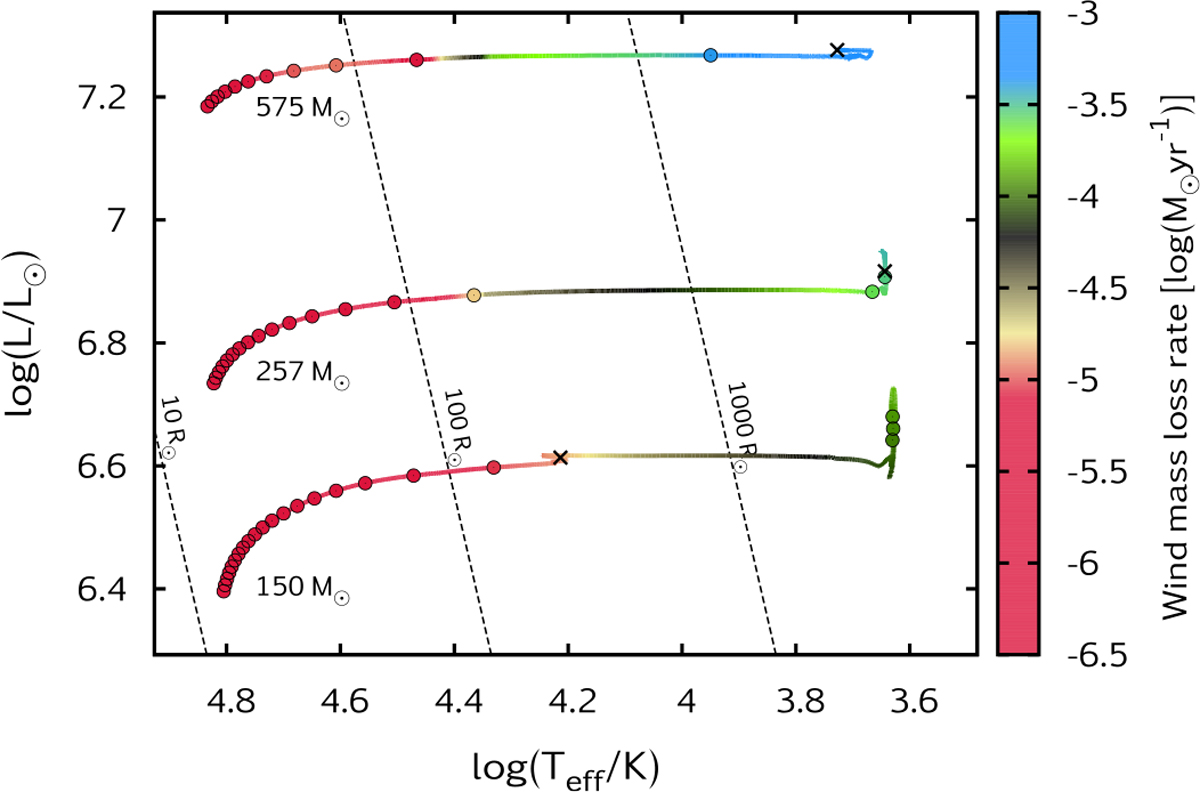
Hertzsprung–Russell diagram of three low-Z evolutionary models that become core-hydrogen-burning SG stars with initial masses of 150, 257, and 575 M⊙ and initial rotational velocity of 100 km s−1. Dots in the tracks mark every 105 years of evolution. Crosses mark the end of the core-hydrogen-burning phase; in case of the model with 575 M⊙, the end of the computation. Theoretical mass-loss rates are colour coded, and dashed lines indicate the radial size of the stars on the diagram.
Current usage metrics show cumulative count of Article Views (full-text article views including HTML views, PDF and ePub downloads, according to the available data) and Abstracts Views on Vision4Press platform.
Data correspond to usage on the plateform after 2015. The current usage metrics is available 48-96 hours after online publication and is updated daily on week days.
Initial download of the metrics may take a while.