Fig. 10
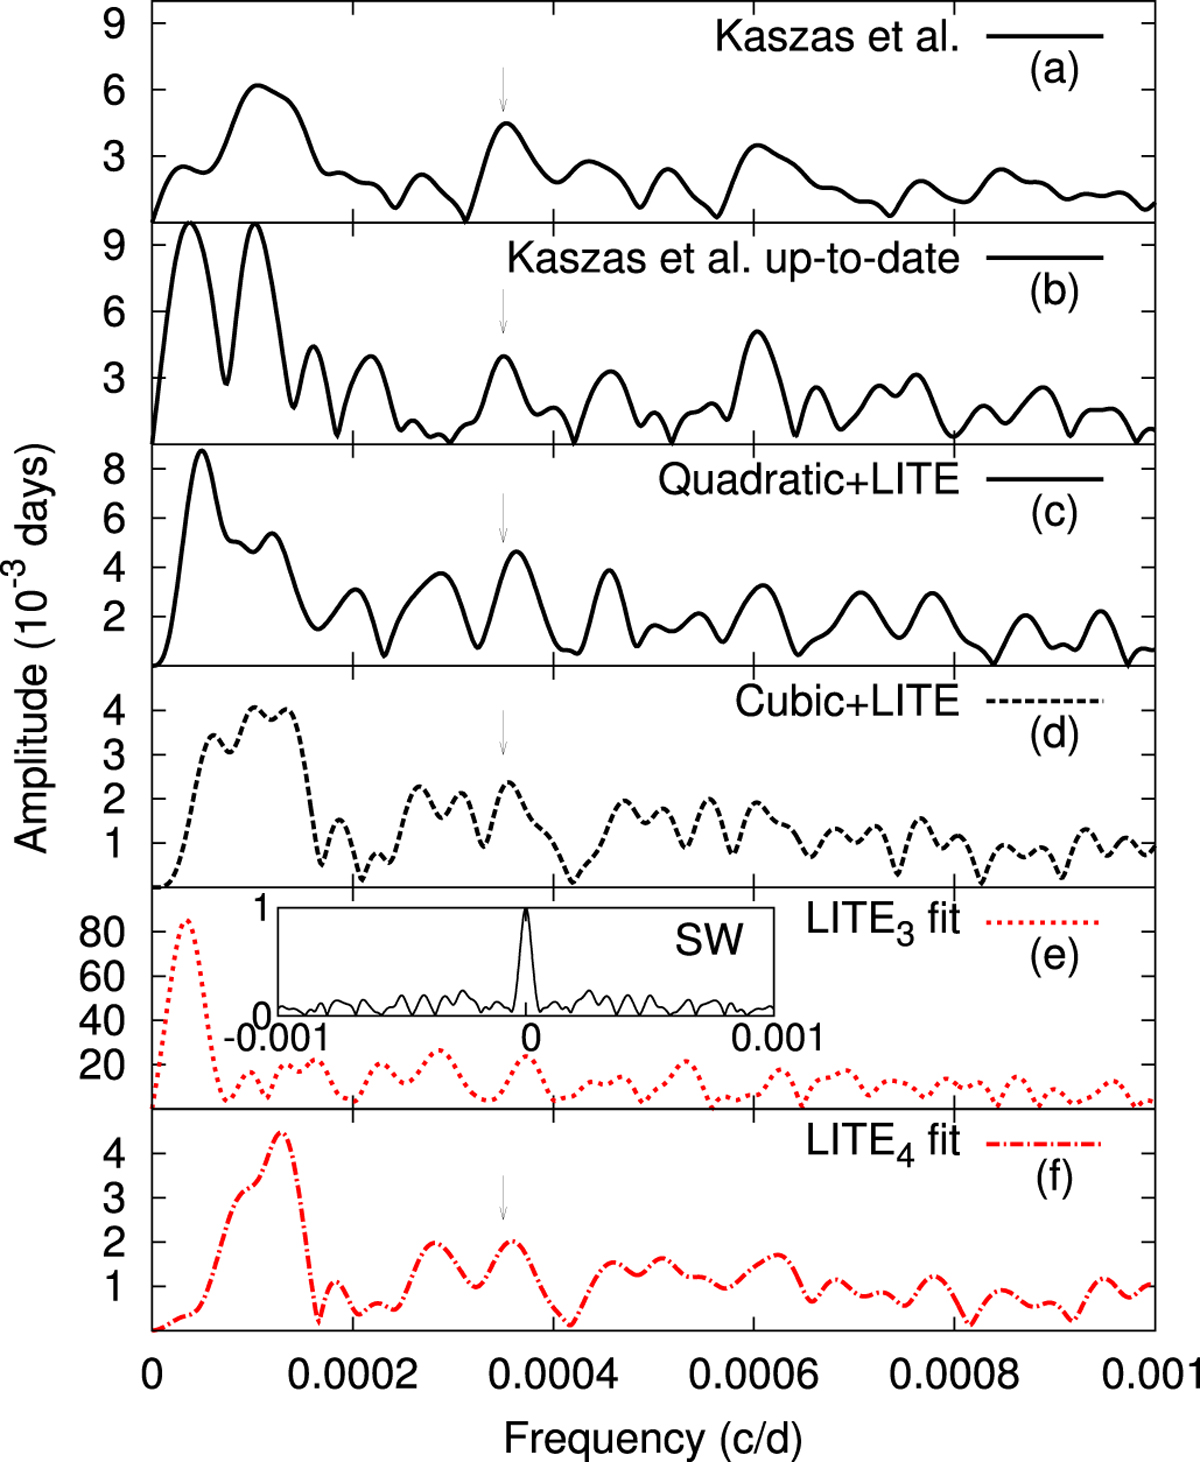
Fourier spectra of the O–C diagrams. From top to bottom: (a) after the subtraction of the parabolic trend (following Kaszás et al. 1998) and the visually observed LITE of the third body using data points before MJD 50 000, (b) same as (a), but using the full dataset, (c) after the subtraction of our quadratic fit along with the LITE of the third body, (d) after the subtraction of our cubic fit along with the LITE of the third body, (e) after the subtraction of the LITE of the third body and (f) after the subtraction of the LITE of the hypothetical fourth body. We highlight the different ranges of the vertical axes. The insert in the fifth panel shows the spectral window.
Current usage metrics show cumulative count of Article Views (full-text article views including HTML views, PDF and ePub downloads, according to the available data) and Abstracts Views on Vision4Press platform.
Data correspond to usage on the plateform after 2015. The current usage metrics is available 48-96 hours after online publication and is updated daily on week days.
Initial download of the metrics may take a while.