Fig. 10
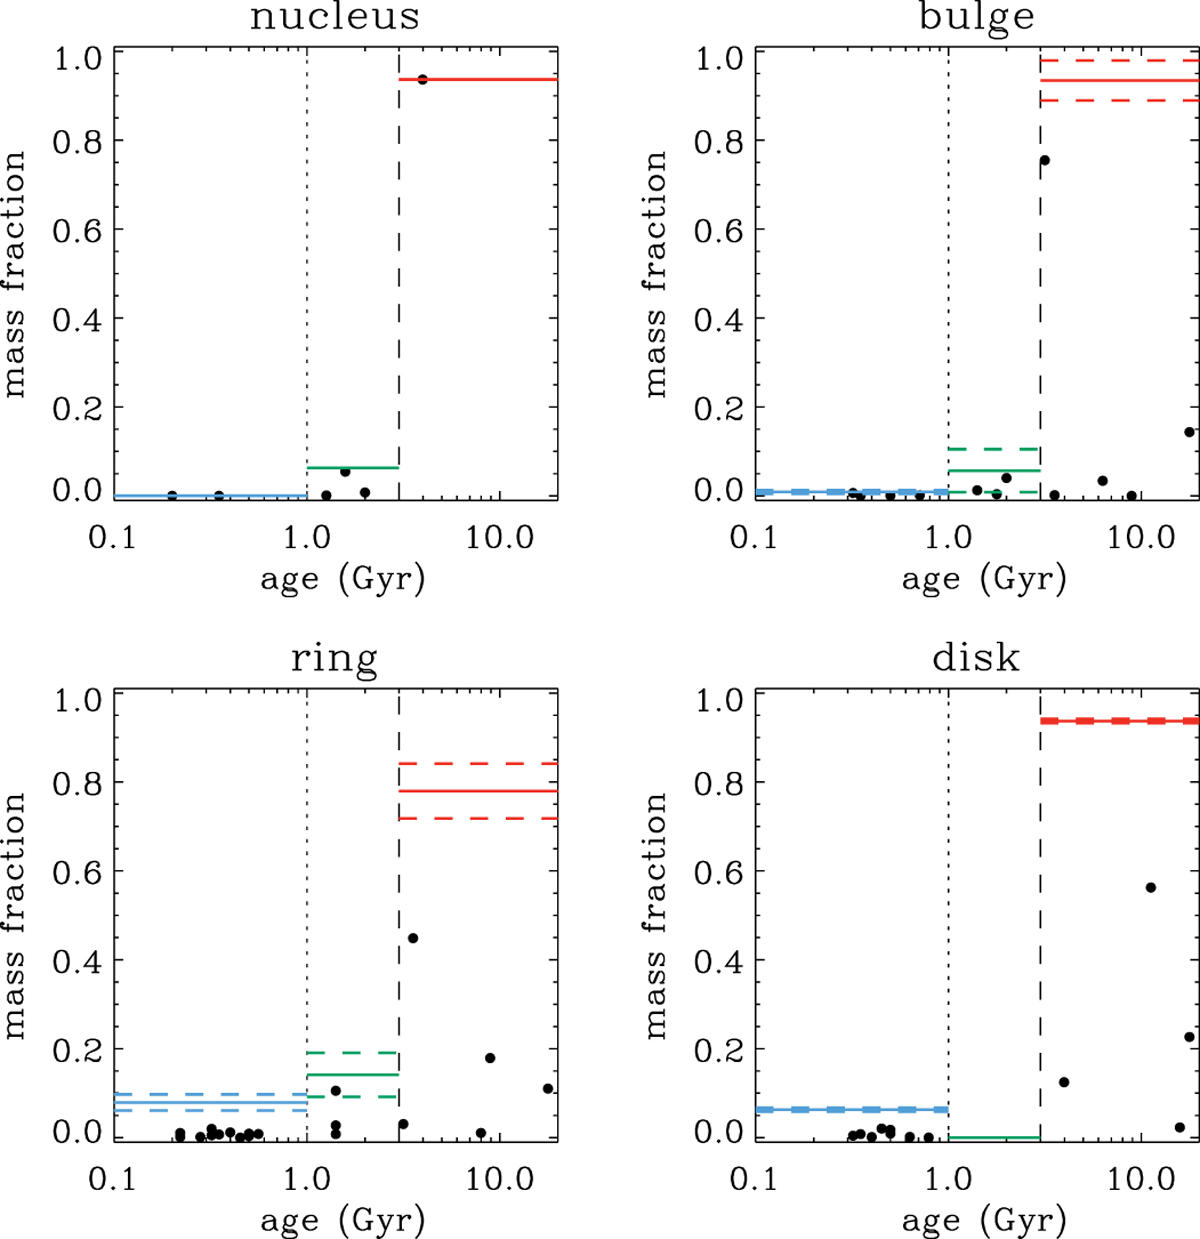
Star-formation histories of the nucleus, bulge, ring, and disk regions. The black dots correspond to the coloured dots in Fig. 9. The locations of the horizontal blue, green, and red lines indicate the mass fraction of the young ( <1 Gyr), intermediate-old (1–3 Gyr), and old ( >3 Gyr) stellar populations, respectively, calculated by adding the contributions from individual templates (black dots). The horizontal dashed lines indicate the formal errors in the mass fractions, deduce by treating each different azimuthal aperture spectrum as an independent probe of the bulge, ring, and disk regions. For the nucleus, errors should be taken to be similar to those reported for the bulge regions, which are similarly dominated by old stellar populations. We note that the disk measurements are very robust, whereas stochastic effects such as the presence of different numbers of HII regions contribute to the larger errors in the stellar-population analysis for the ring region.
Current usage metrics show cumulative count of Article Views (full-text article views including HTML views, PDF and ePub downloads, according to the available data) and Abstracts Views on Vision4Press platform.
Data correspond to usage on the plateform after 2015. The current usage metrics is available 48-96 hours after online publication and is updated daily on week days.
Initial download of the metrics may take a while.