Fig. 9
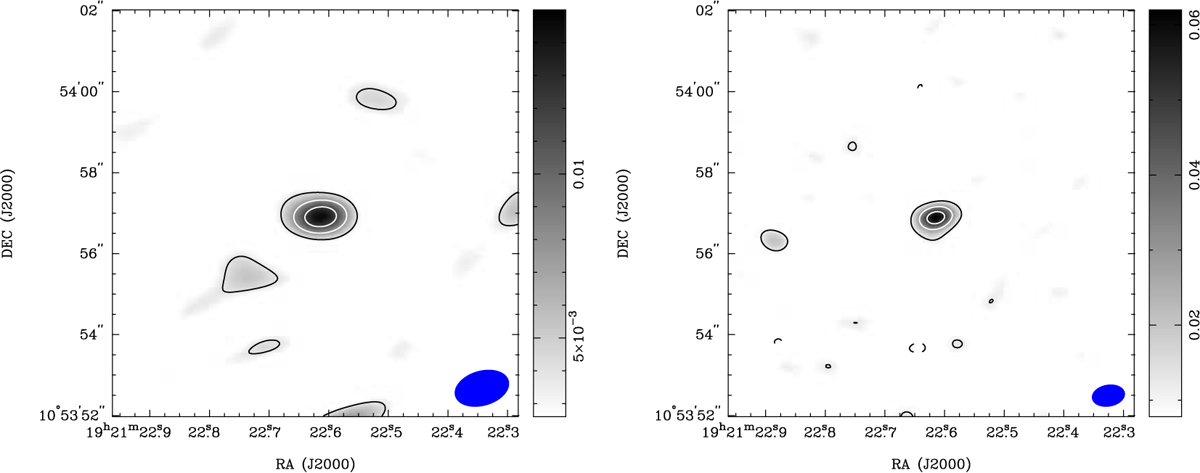
1.3 mm (left) and 0.9 (right) continuum images of HH 250-IRS A obtained with our SMA observations. The images are not corrected for the primary beam attenuation. Contour levels start from 3σ in steps of 3σ in the 1.3 mm image and in steps of 5σ in the 0.9 mm image, where 1σ is 1.3 and 3.9 mJy Beam−1, respectively.Filled blue ellipses show the sizes of the synthesized beams.
Current usage metrics show cumulative count of Article Views (full-text article views including HTML views, PDF and ePub downloads, according to the available data) and Abstracts Views on Vision4Press platform.
Data correspond to usage on the plateform after 2015. The current usage metrics is available 48-96 hours after online publication and is updated daily on week days.
Initial download of the metrics may take a while.