Fig. 8
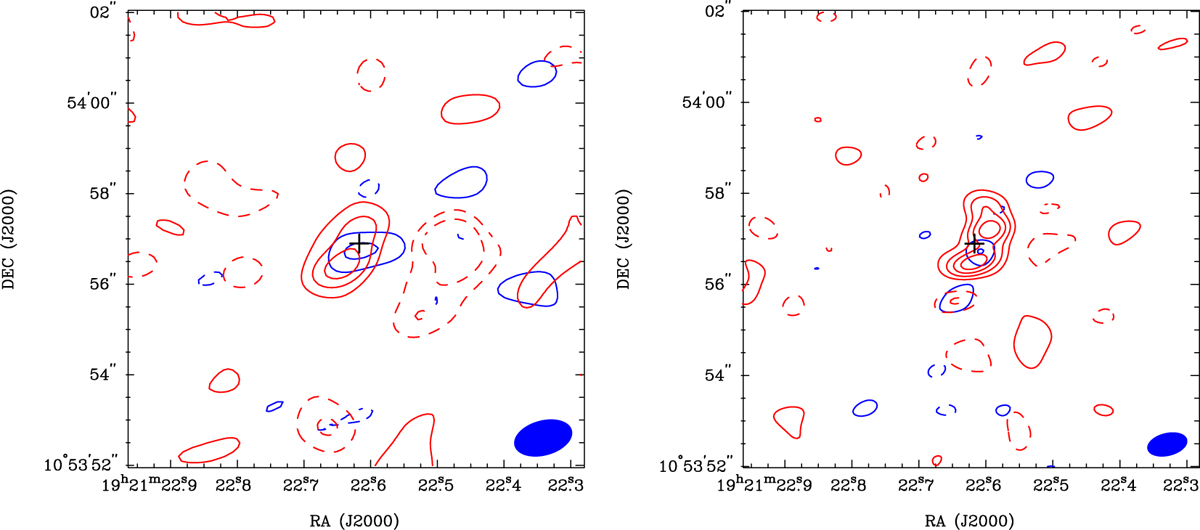
Integrated intensity maps of the CO (2–1; left) and (3–2; right) emission obtained with our SMA observations. Blue and red contours present the blueshifted and redshifted velocity components centered at V LSR ~ 4.6 km s−1 and V LSR ~ 10.7 km s−1, respectively. The integrated velocity widths of the blueshifted and redshifted components are 1.5 km s−1 and 3.5 km s−1 in the CO (2–1) emission, and those are 1 km s−1 and 3 km s−1 in the CO (3–2) emission. Crosses denote the continuum peak position, and filled blue ellipses show the sizes of the synthesized beams. Contours are from 3σ in steps of 2σ. 1σ noise levels in the CO (2–1) maps of the blueshifted and redshifted components are 0.14 and 0.2 Jy beam−1 km s−1, and those are 0.15 and 0.24 Jy beam−1 km s−1 in the CO (3–2) maps.
Current usage metrics show cumulative count of Article Views (full-text article views including HTML views, PDF and ePub downloads, according to the available data) and Abstracts Views on Vision4Press platform.
Data correspond to usage on the plateform after 2015. The current usage metrics is available 48-96 hours after online publication and is updated daily on week days.
Initial download of the metrics may take a while.