Fig. 7
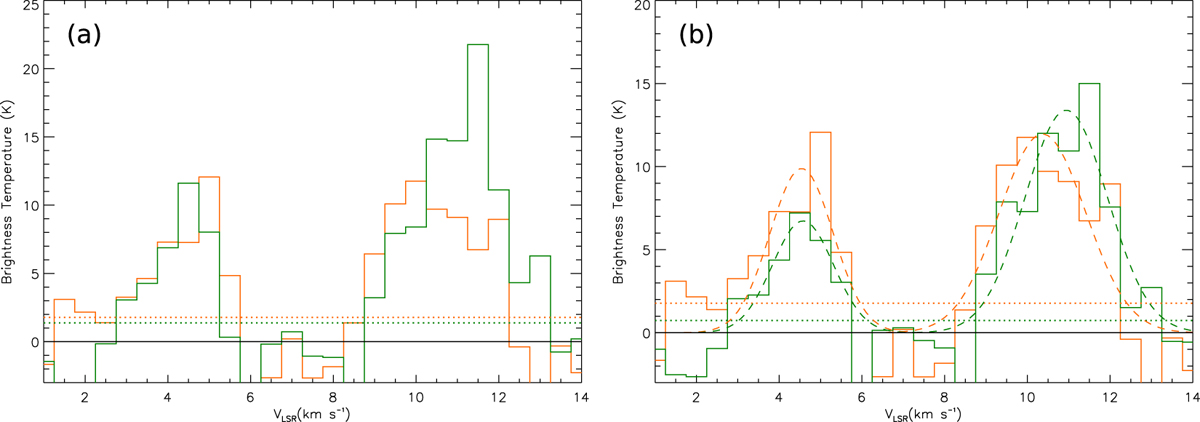
CO spectra obtained with our SMA observations. Orange and green histograms present the CO (2–1) and (3–2) emission, respectively. The spectra in both panel a and b were extracted by averaging over the region with a radius of 0.′′ 5 centered on the continuum peak position from the images with the correction of the primary beam attenuation. Dashed lines denote 1σ noise levels of the spectra. In panel b, the CO (3–2) spectrum was extracted after convolving the CO (3–2) image with the same angular resolution of the CO (2–1) image. Red and blue curves show the Gaussian fitting results of the line profiles.
Current usage metrics show cumulative count of Article Views (full-text article views including HTML views, PDF and ePub downloads, according to the available data) and Abstracts Views on Vision4Press platform.
Data correspond to usage on the plateform after 2015. The current usage metrics is available 48-96 hours after online publication and is updated daily on week days.
Initial download of the metrics may take a while.