Fig. 6
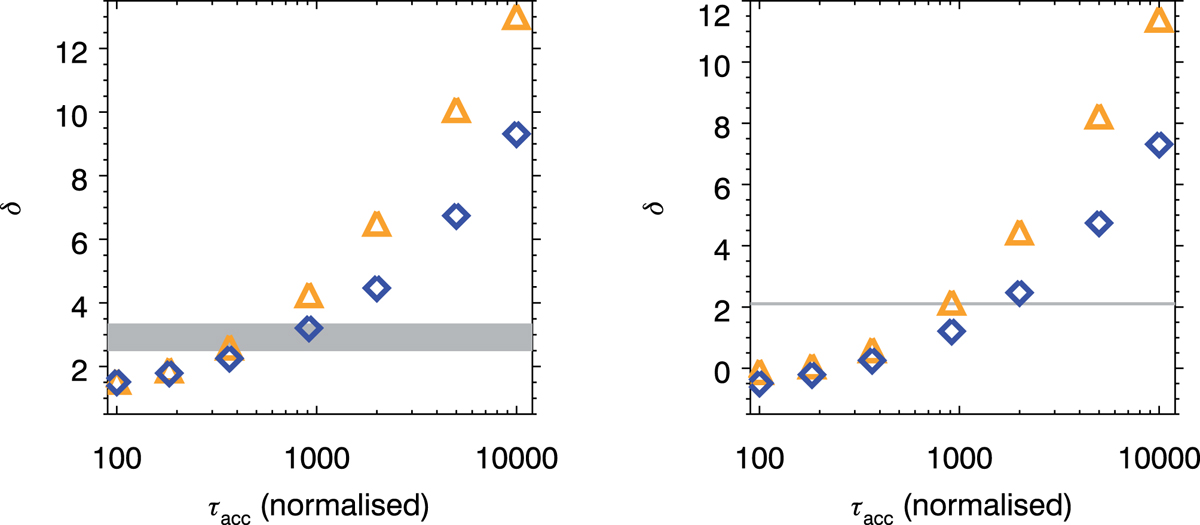
Spectral index, δ, calculated from the mean electron flux shown in Fig. 5 for looptop (left) and footpoint (right). The grey confidence strip shows the possible range of δobs for the fit (![]() and
and ![]() ).
Orange triangles are the δ
obtained from fitting the simulated ⟨nV F(E)⟩
between 25 and 50 keV. The blue diamonds show the predicted spectral index from the leaky-box approximation.
).
Orange triangles are the δ
obtained from fitting the simulated ⟨nV F(E)⟩
between 25 and 50 keV. The blue diamonds show the predicted spectral index from the leaky-box approximation.
Current usage metrics show cumulative count of Article Views (full-text article views including HTML views, PDF and ePub downloads, according to the available data) and Abstracts Views on Vision4Press platform.
Data correspond to usage on the plateform after 2015. The current usage metrics is available 48-96 hours after online publication and is updated daily on week days.
Initial download of the metrics may take a while.