Free Access
Fig. 5
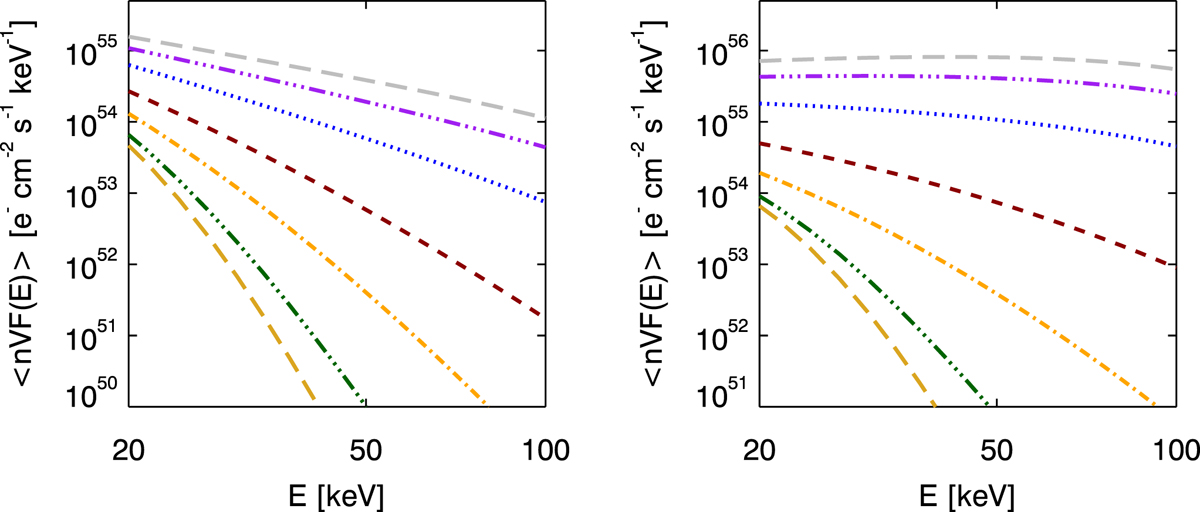
Simulated ⟨nV F(E)⟩ for the scatter-free transport case for coronal source (left) and footpoint source (right) for acceleration timescales:
![]() (grey dash line),
(grey dash line), ![]() (purple triple dot-dash line),
(purple triple dot-dash line), ![]() (blue dot line),
(blue dot line), ![]() (maroon dash line),
(maroon dash line), ![]() (orange dot-dash line),
(orange dot-dash line), ![]() (green triple dot-dash line),
(green triple dot-dash line), ![]() (yellow long dash line).
(yellow long dash line).
Current usage metrics show cumulative count of Article Views (full-text article views including HTML views, PDF and ePub downloads, according to the available data) and Abstracts Views on Vision4Press platform.
Data correspond to usage on the plateform after 2015. The current usage metrics is available 48-96 hours after online publication and is updated daily on week days.
Initial download of the metrics may take a while.