Fig. 3

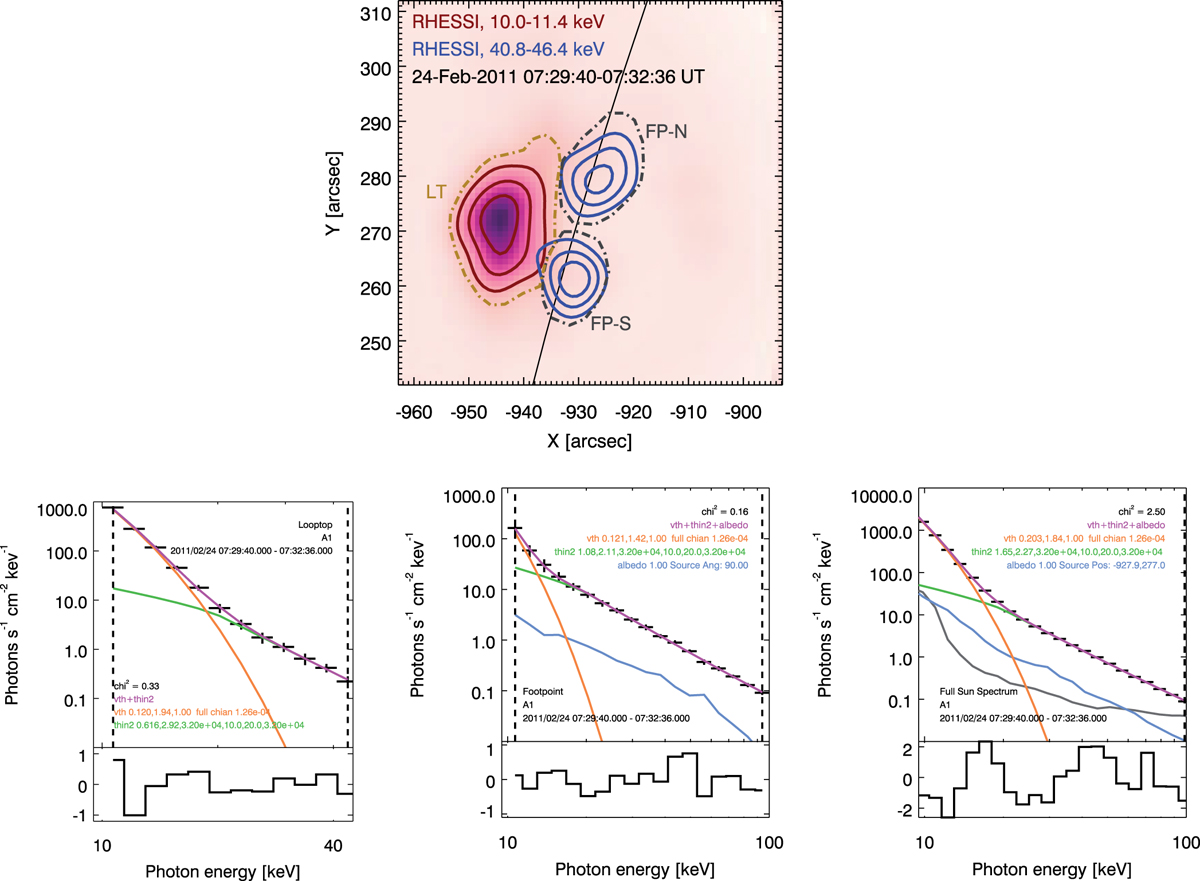
Top: CLEAN image of the 2011 Feb 24 flare. The dot-dash lines show the looptop (LT) and footpoint (FP-N, FP-S) regions used to produce spectra. The red contours show the looptop emission in the 10.0–11.4 keV (30%, 50% and 75%) energy band overplotted over the CLEAN image in the same range. The footpoint emission at 40.8–46.4 keV is shown by the blue contours (30%, 50% and 75%). Also shown are photon X-ray spectra for the flare: bottom left, looptop spectrum; bottom middle, summed footpoint spectrum; and bottom right, full-Sun spectrum. HXR spectrum is shown as black data points. Fitting result is shown by the magenta line and is composed of a thermal (orange) and thin-target (green) component, with an albedo correction (blue) for the footpoint and full-Sun spectra. The full-Sun spectrum also shows the background emission in grey. The range fitted for each case is shown by the vertical dashed lines.
Current usage metrics show cumulative count of Article Views (full-text article views including HTML views, PDF and ePub downloads, according to the available data) and Abstracts Views on Vision4Press platform.
Data correspond to usage on the plateform after 2015. The current usage metrics is available 48-96 hours after online publication and is updated daily on week days.
Initial download of the metrics may take a while.


