Fig. 9
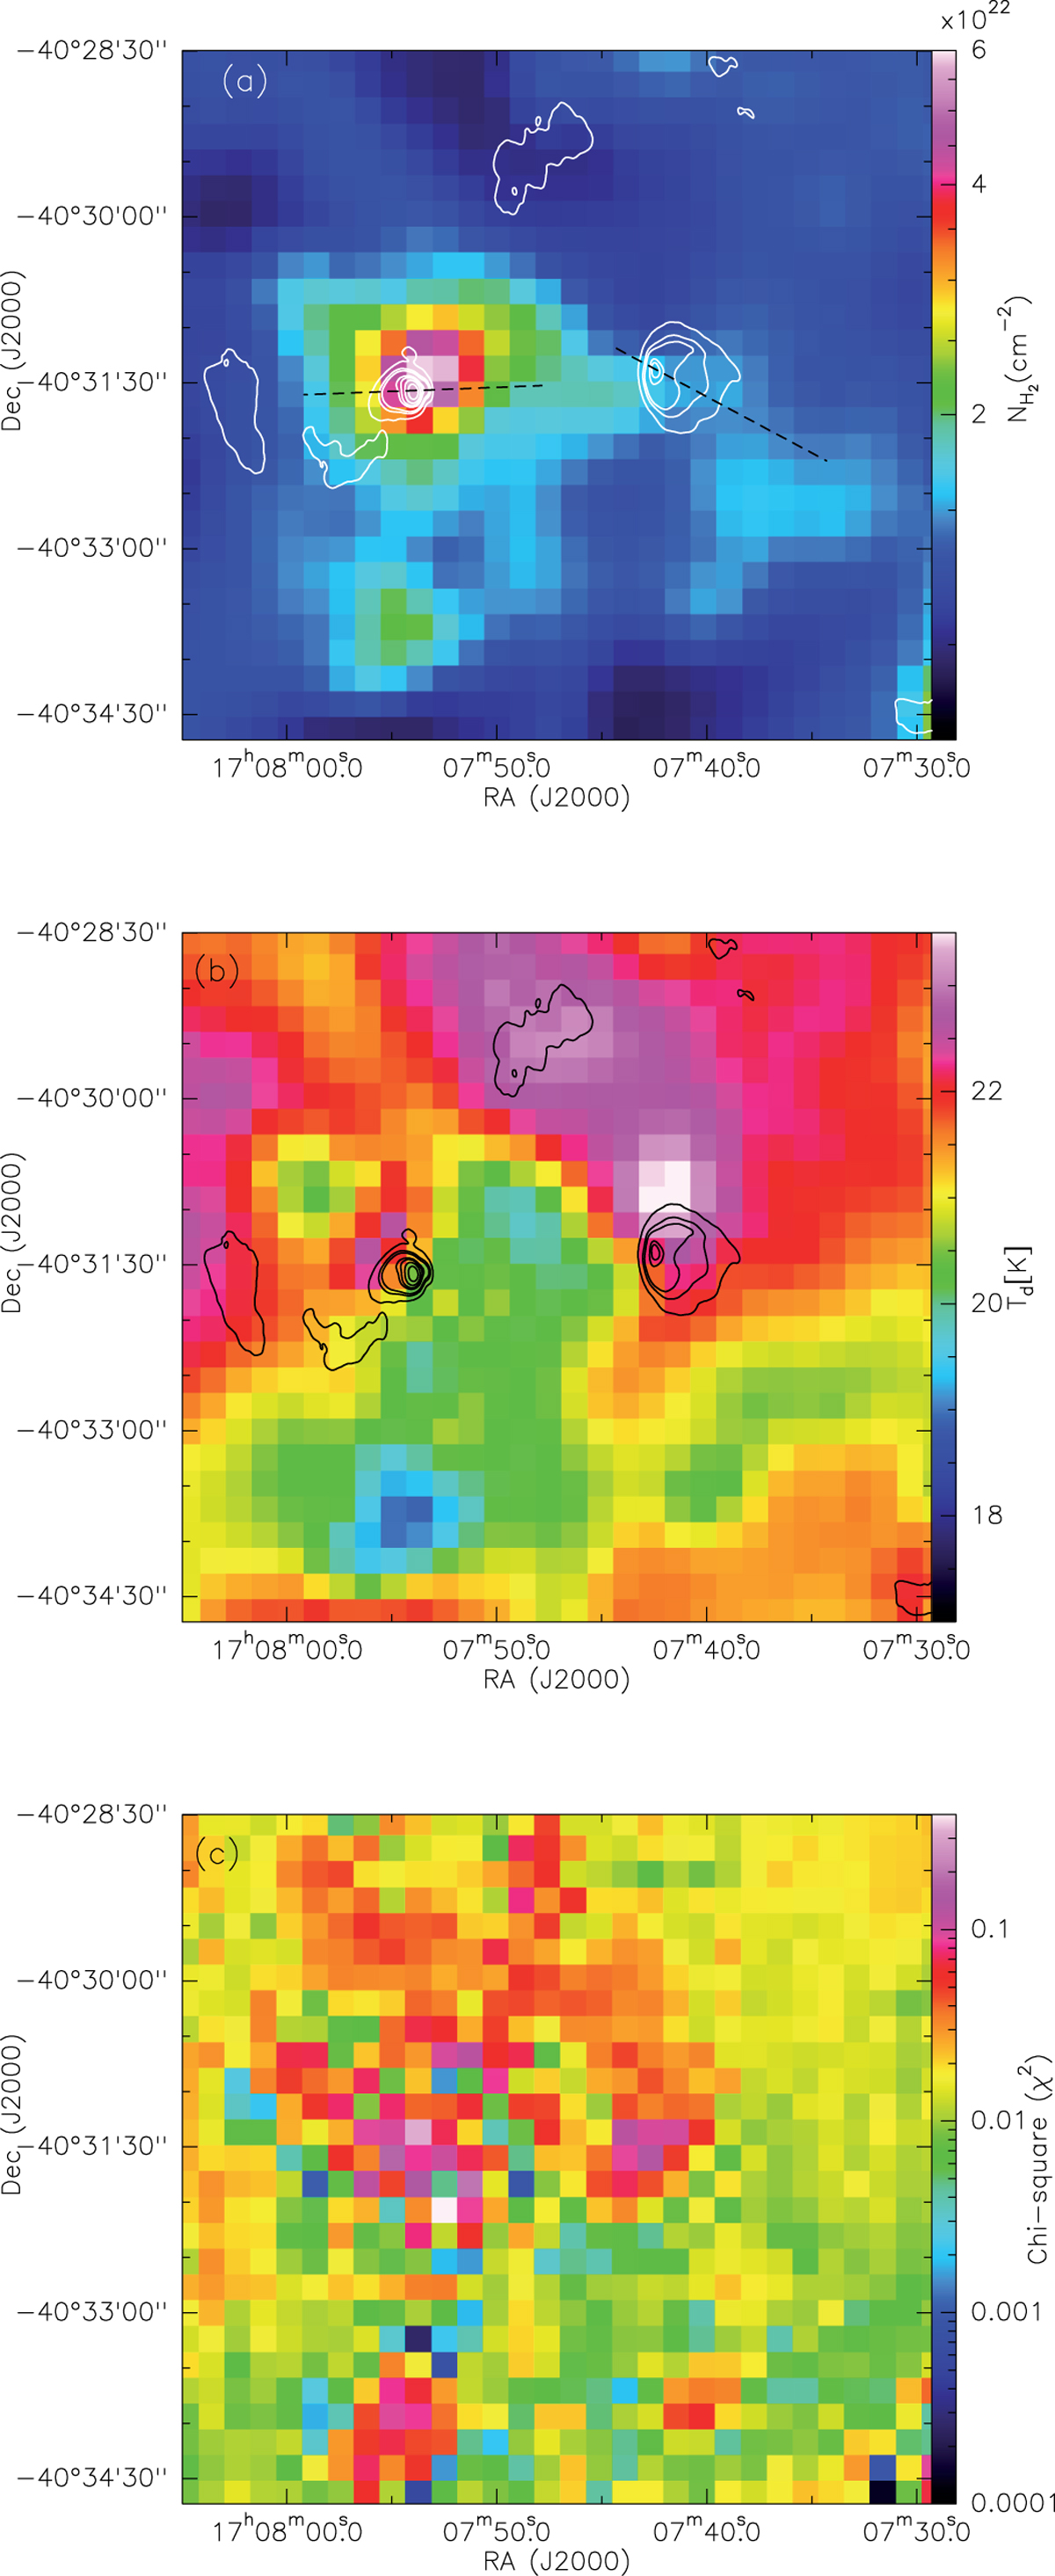
Column density (panel a), dust temperature (panel b) and chi-square (χ2 ) (panel c) maps of the region associated to H II regions. 1280 MHz GMRT radio emission is shown as contours. The contour levels are same as those plotted in Fig. 6. The dashed line on the H II regions shows the projections, the column density variation which is used to understand the morphology of the ionized region in a later section.
Current usage metrics show cumulative count of Article Views (full-text article views including HTML views, PDF and ePub downloads, according to the available data) and Abstracts Views on Vision4Press platform.
Data correspond to usage on the plateform after 2015. The current usage metrics is available 48-96 hours after online publication and is updated daily on week days.
Initial download of the metrics may take a while.