Fig. 7
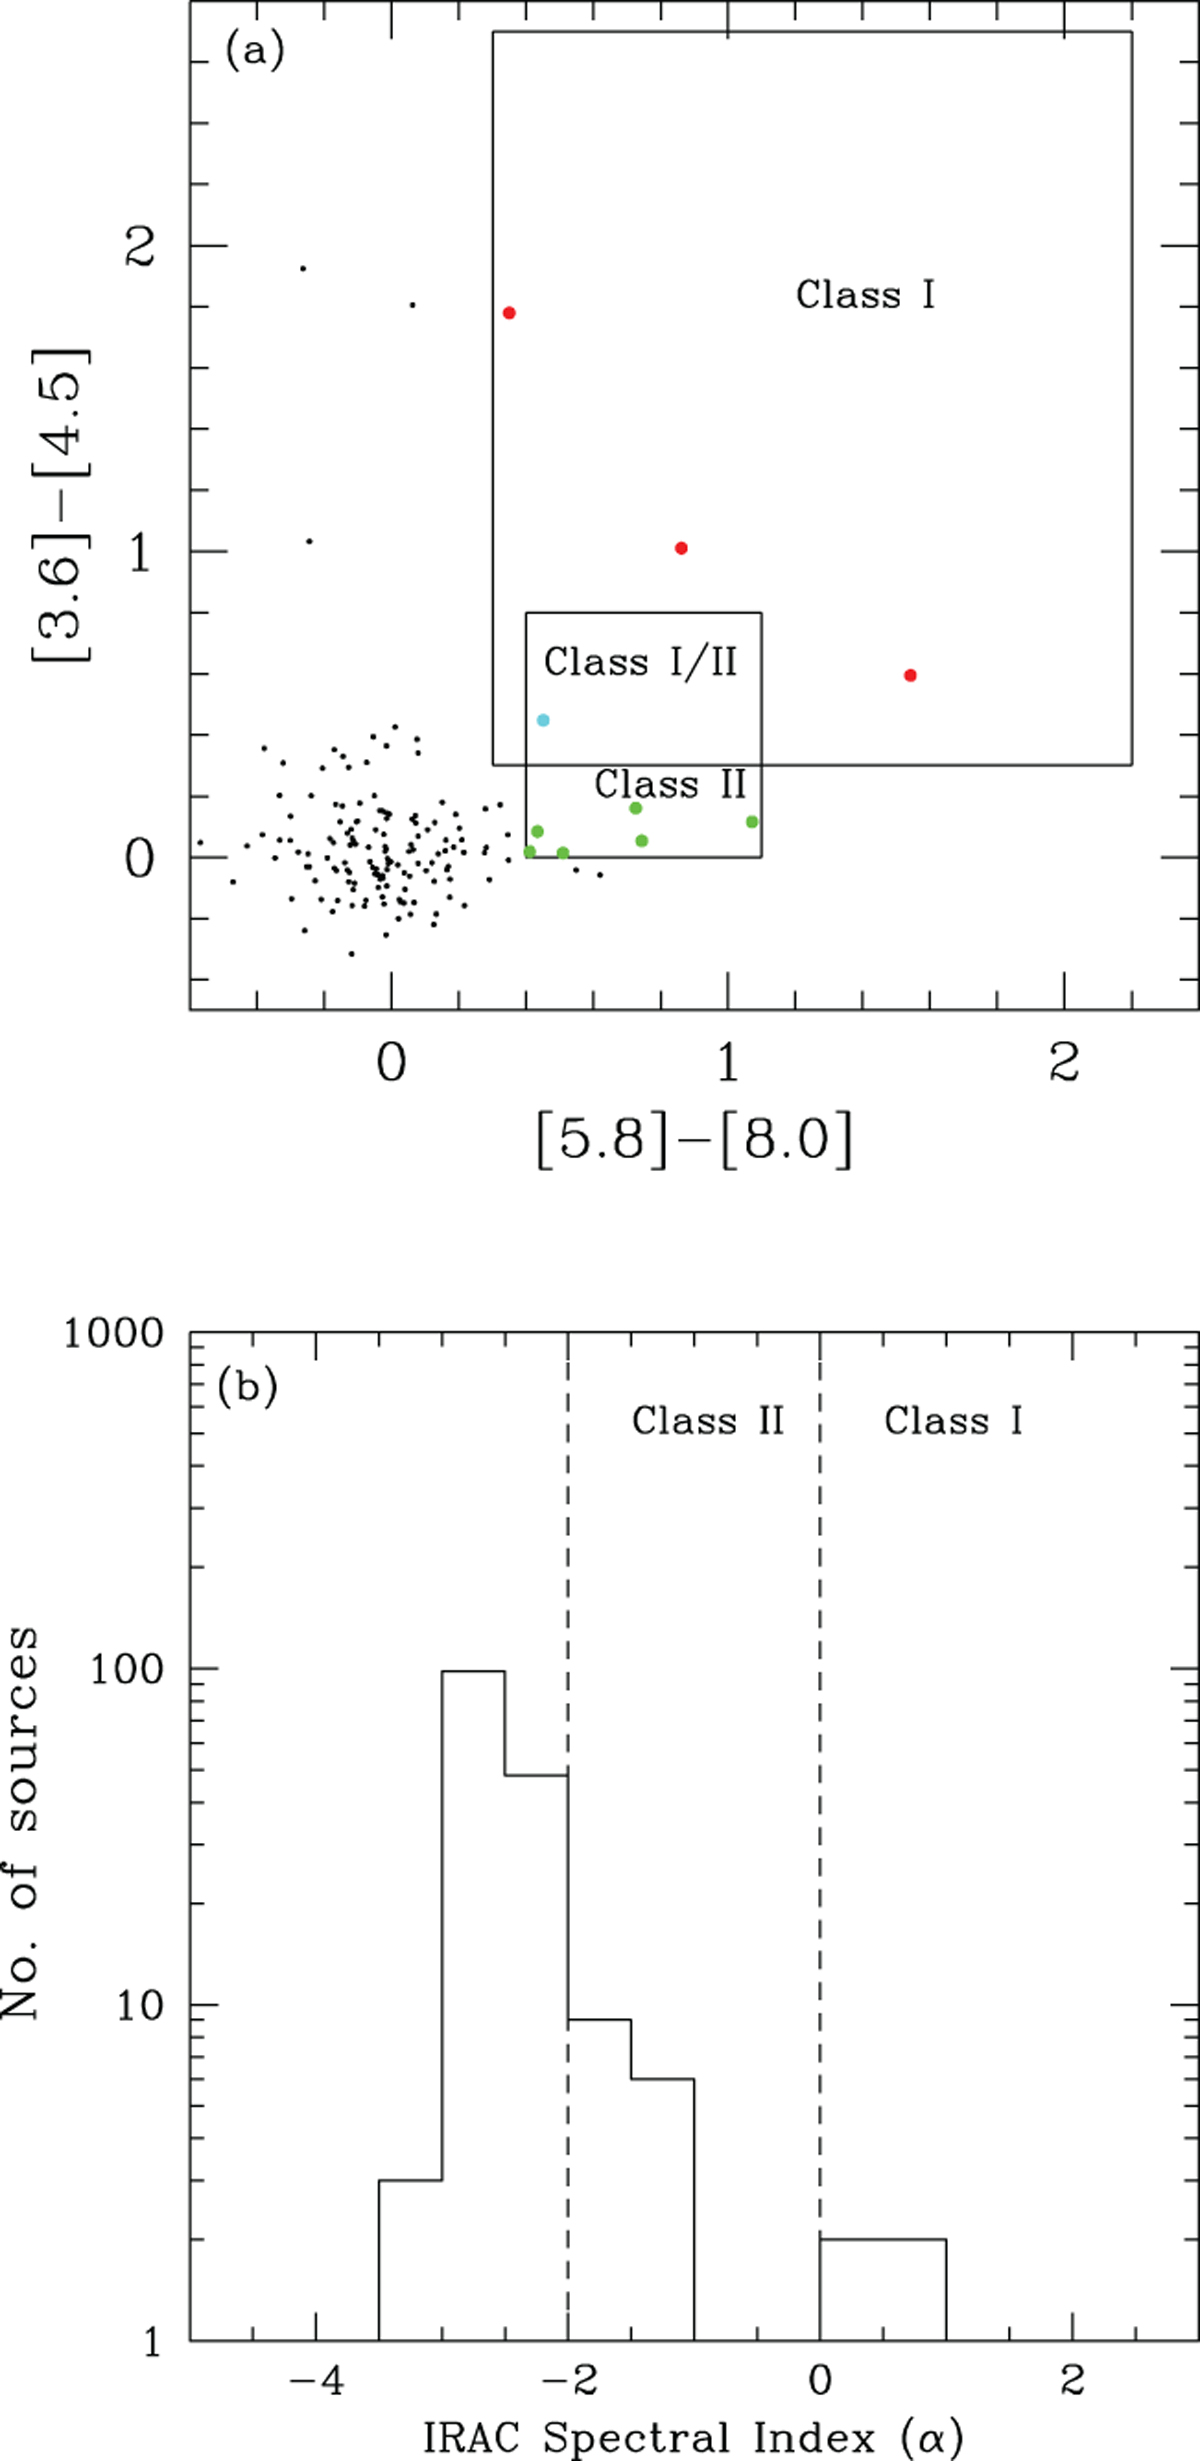
Panel a: IRAC color-color plot for the sources in the H IIregions. The boxes demarcate the location of Class I (larger box)and Class II (smaller box) (Vig et al. 2007). Sources falling in the overlapping area are designated as Class I/II. The identified YSOs have the following color coding - Class I (red), Class II (green) and Class I/II (cyan). Panel b: histogram showing the number of sources within specified spectral index bins. The regions demarcated on the plot are adopted from Chavarría et al. (2008) for classification of YSOs.
Current usage metrics show cumulative count of Article Views (full-text article views including HTML views, PDF and ePub downloads, according to the available data) and Abstracts Views on Vision4Press platform.
Data correspond to usage on the plateform after 2015. The current usage metrics is available 48-96 hours after online publication and is updated daily on week days.
Initial download of the metrics may take a while.