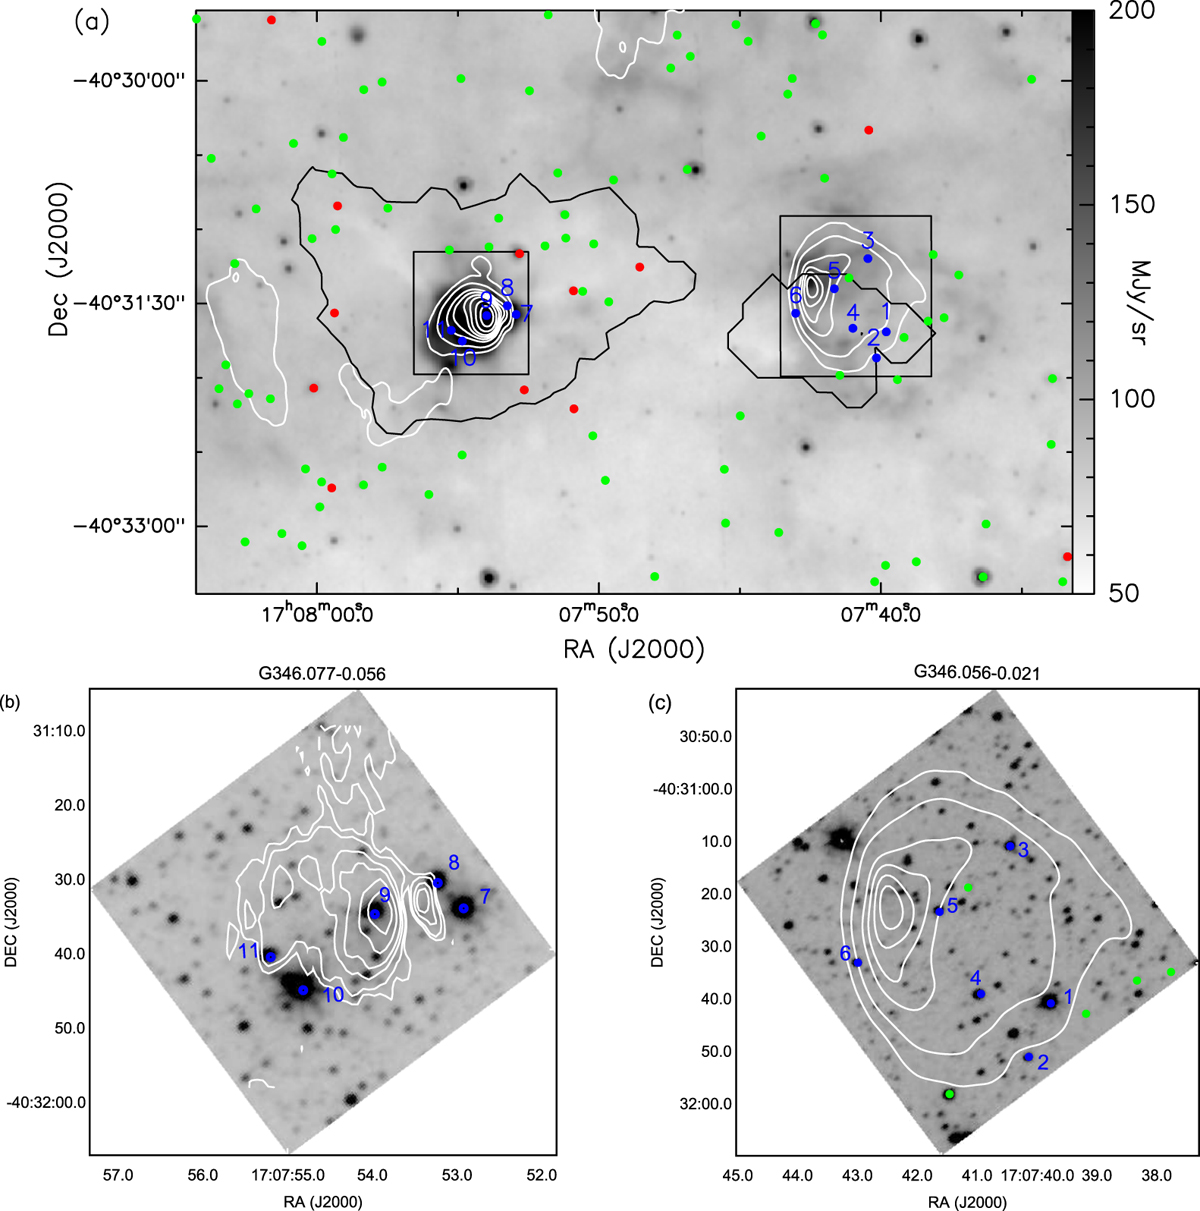
Fig. 6

Panel a: distribution of candidate ionizing stars and YSOs on the Spitzer 8.0 μm image. Identified YSOs have the following color coding – Class I (red), Class II (green). The ionizing stars are shown in blue. The detected clump apertures (see Sect. 3.3) are displayed in black. 1280 MHz (low resolution) radio contours are overlaid with levels of 3, 9, 13, 25, 30, 40, and 50 times σ. Panels b and c: zooms of regions (marked as black rectangles in panel a) associated with G346.077−0.056 and G346.056−0.021, respectively, on the K-band VVV image. In panel b, we have overlaid the high-resolution 1280 MHz radio contours shown in Fig. 2 to reveal the finer structures.
Current usage metrics show cumulative count of Article Views (full-text article views including HTML views, PDF and ePub downloads, according to the available data) and Abstracts Views on Vision4Press platform.
Data correspond to usage on the plateform after 2015. The current usage metrics is available 48-96 hours after online publication and is updated daily on week days.
Initial download of the metrics may take a while.


