Fig. 5
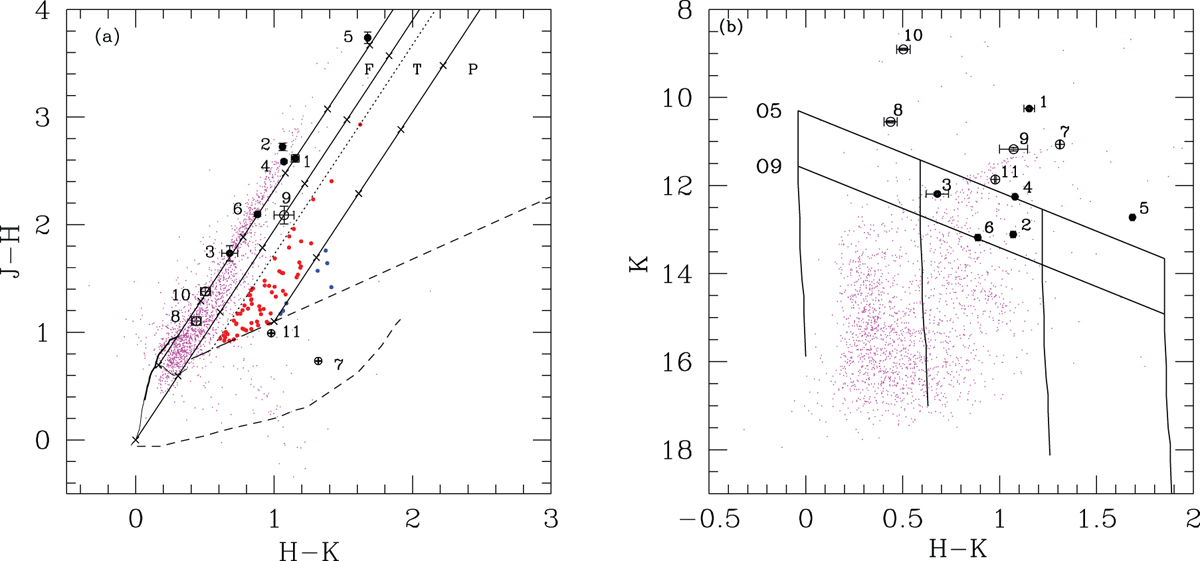
Panel a: (J−H) vs (H−K) CCP for the region associated with the H II regions. The loci of main sequence (thin line) and giants (thick line) are taken from Bessell & Brett (1988). The classical T Tauri locus (long dashed line) is adopted from Meyer et al. (1997) and that for the Herbig AeBe stars (short dashed line) is from Lada & Adams (1992). The parallel lines are thereddening vectors where cross marks indicate intervals of 5 mag of visual extinction. The interstellar reddening law assumed is from Rieke & Lebofsky (1985). The colors and curves in the CCP are all converted into Bessell & Brett (1988) system. The regions “F”, “T”, and “P” are discussed in the text. The dotted line parallel to the reddening vector accounting for an offset of three times the photometric error in the bands. On the CCP, the Class I sources (blue) and Class II sources (red) are shown as filled circles. The candidate ionizing stars are shown as filled black circles (for G346.056−0.021) and open circles (for G346.077−0.056) on both CCP and CMP. The individual error bars on the colors and magnitude are also plotted. Panel b: K vs (H−K) CMP for the region associated with the H II regions. The nearly vertical solid lines represent the ZAMS loci with 0, 10, 20 and 30 magnitudes of visual extinction corrected for the distance. The slanting lines show the reddening vectors for spectraltypes O9 and O5. The magnitudes and the ZAMS loci are all plotted in the Bessell & Brett (1988) system.
Current usage metrics show cumulative count of Article Views (full-text article views including HTML views, PDF and ePub downloads, according to the available data) and Abstracts Views on Vision4Press platform.
Data correspond to usage on the plateform after 2015. The current usage metrics is available 48-96 hours after online publication and is updated daily on week days.
Initial download of the metrics may take a while.