Fig. 4
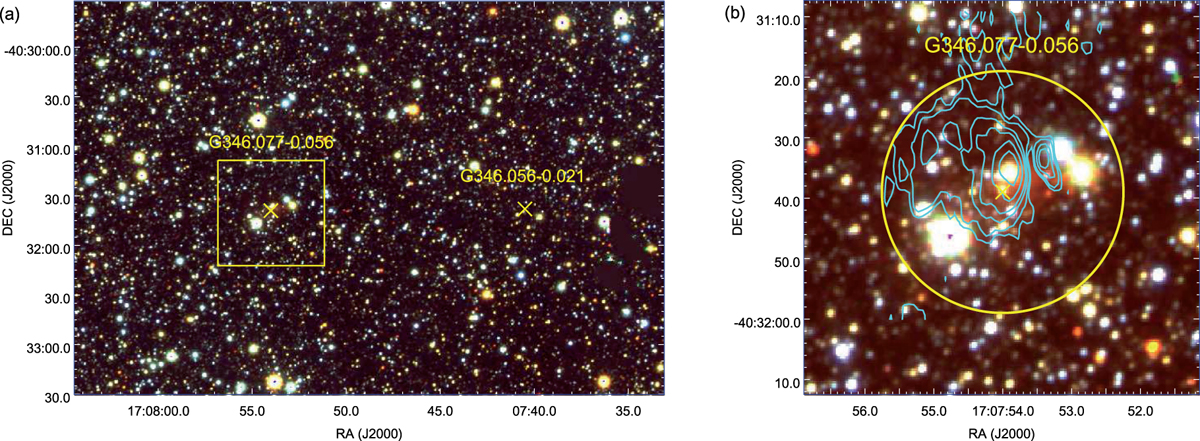
Panel a: NIR color composite image of the region associated with the H II regions using VVV JHK bandimages (red – K; green – H; blue – J). “×” marks show the location of the H II regions. Panel b: zoomed in view of indicated region related to G346.077−0.056. The yellow circle denotes the size of the cluster as estimated by Borissova et al. (2011). The cyan contours show the higher-resolution 1280 MHz radio emission with the levels same as those plotted in Fig. 2.
Current usage metrics show cumulative count of Article Views (full-text article views including HTML views, PDF and ePub downloads, according to the available data) and Abstracts Views on Vision4Press platform.
Data correspond to usage on the plateform after 2015. The current usage metrics is available 48-96 hours after online publication and is updated daily on week days.
Initial download of the metrics may take a while.