Fig. 3
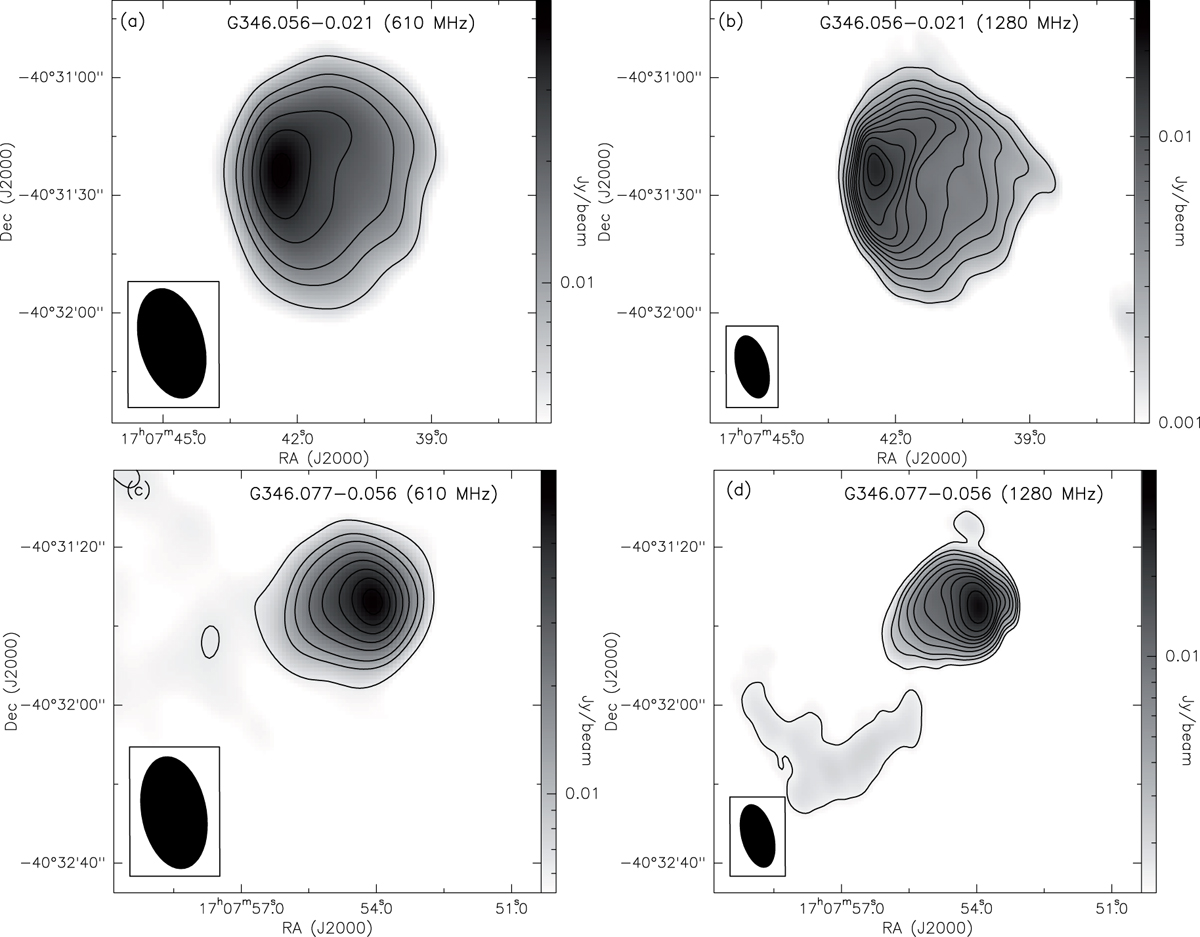
Sameas in Fig. 2, but for maps generated with “robustness parameter” +1 and appropriate uv tapering to weigh down long baselines. The contour levels are 3, 5, 7, 11, 15, 20, 25, 30, 40, and 55 times σ where σ is 2.1 mJy beam−1 and 0.5 mJybeam−1 at 610 MHz and 1280 MHz, respectively. Beam in each band is shown as filled ellipse.
Current usage metrics show cumulative count of Article Views (full-text article views including HTML views, PDF and ePub downloads, according to the available data) and Abstracts Views on Vision4Press platform.
Data correspond to usage on the plateform after 2015. The current usage metrics is available 48-96 hours after online publication and is updated daily on week days.
Initial download of the metrics may take a while.