Fig. 2
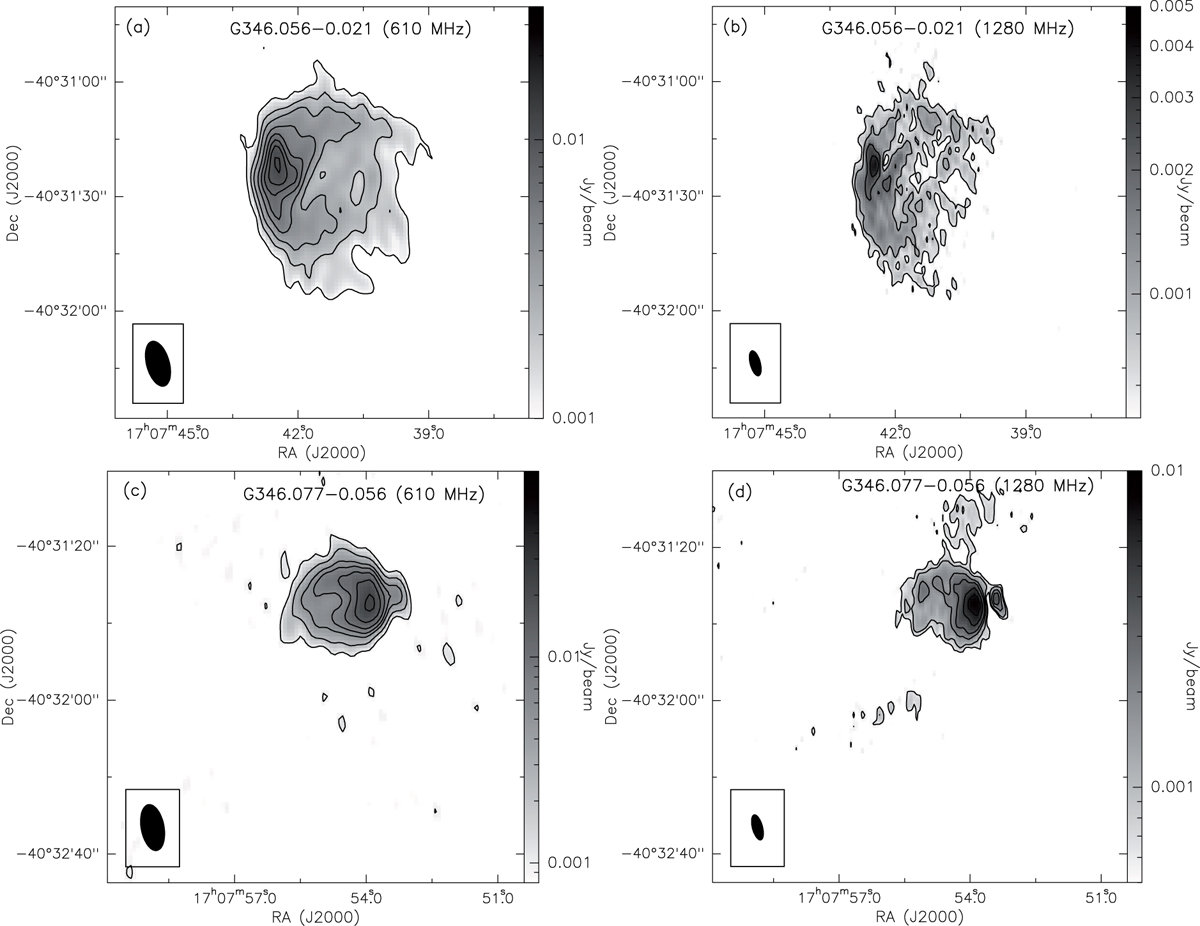
Ionized emission associated with the H IIregions – panels a and b: 610 and 1280 MHz maps for the region associated with G346.056−0.021; panels c and d: 610 and 1280 MHz emission for the region around G346.077−0.056. The contourlevels are 3, 5, 10, 15, 20, 25, 30, and 35 times σ, where σ is equal to 0.3 mJy beam−1 and 0.2 mJybeam−1 at 610 MHz and 1280 MHz, respectively. Beam in each band is shown as filled ellipse. These maps are generated by setting the “robustness parameter” to −5 and withoutany uv tapering.
Current usage metrics show cumulative count of Article Views (full-text article views including HTML views, PDF and ePub downloads, according to the available data) and Abstracts Views on Vision4Press platform.
Data correspond to usage on the plateform after 2015. The current usage metrics is available 48-96 hours after online publication and is updated daily on week days.
Initial download of the metrics may take a while.