Fig. 12
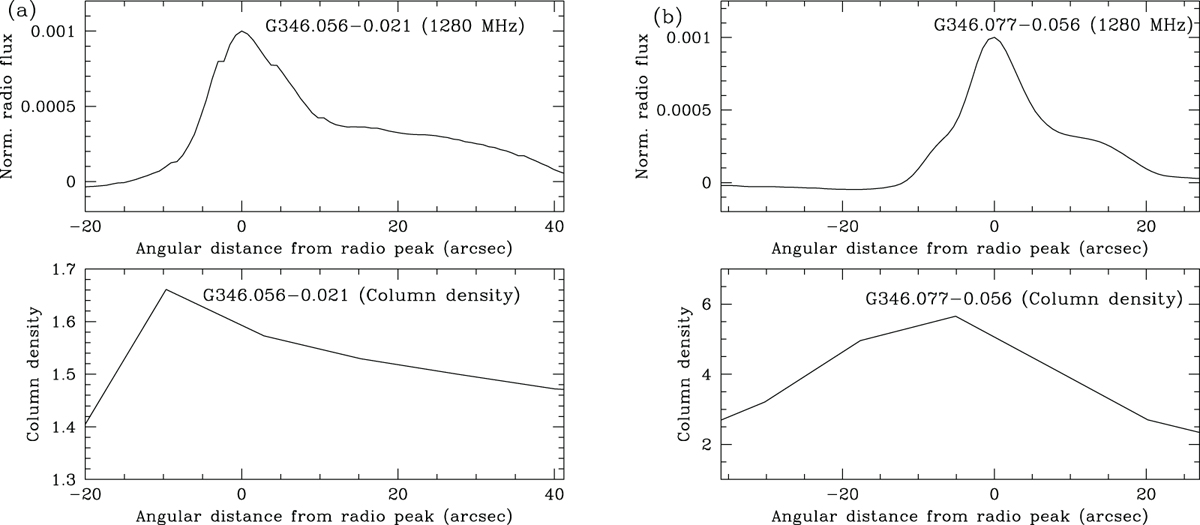
Relative distribution of radio emission and column density with respect to the radio peaks for G346.056−0.021 and G346.077−0.056 along the projections shown in the column density map in Fig. 9. Zero on the x-axis corresponds to the position of the radio peaks increasing towards the direction of the tail (south-west for G346.056−0.021 and east for G346.077−0.056). The radio flux densities plotted are normalized to the peak flux densities and the column density is given in terms of 1022 cm −2.
Current usage metrics show cumulative count of Article Views (full-text article views including HTML views, PDF and ePub downloads, according to the available data) and Abstracts Views on Vision4Press platform.
Data correspond to usage on the plateform after 2015. The current usage metrics is available 48-96 hours after online publication and is updated daily on week days.
Initial download of the metrics may take a while.