Fig. 1
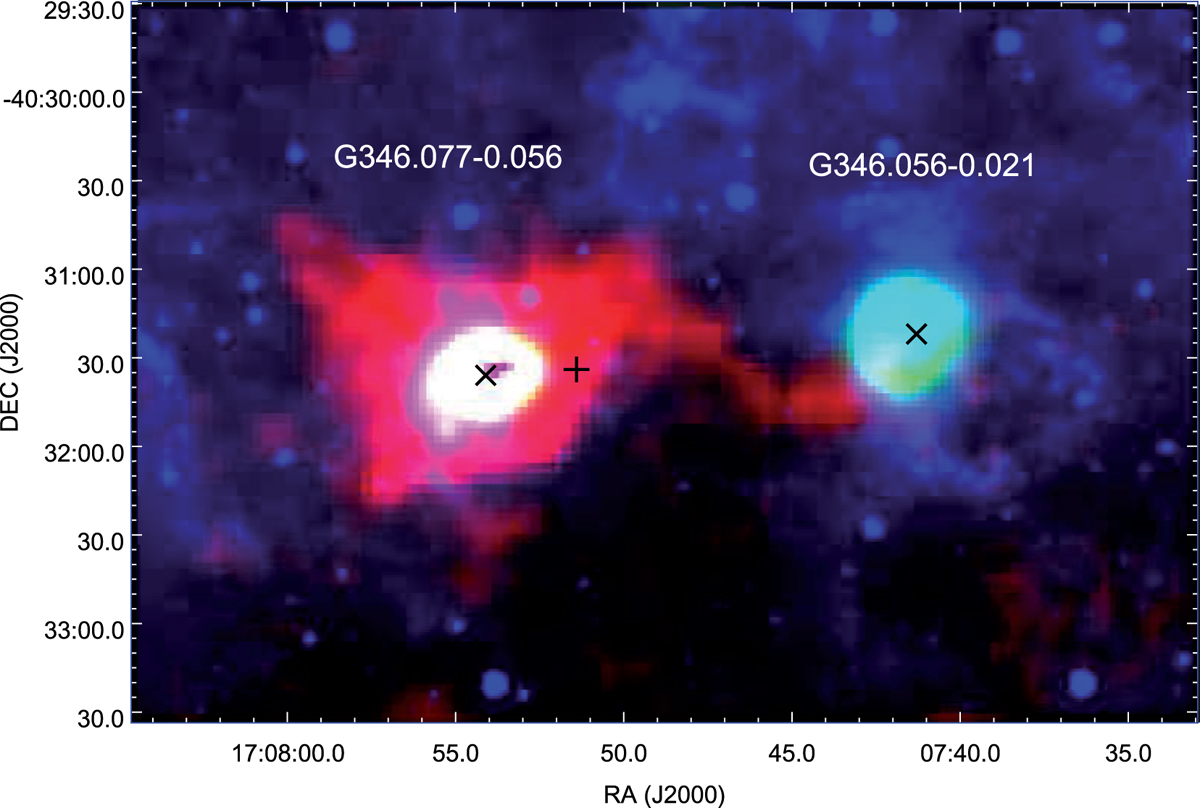
Color composite image of the region associated with G346.056−0.021 and G346.077−0.056 using IRAC 8.0 μm band (see Sect. 2.2.2; blue), MIPS 24 μm (MIPSGAL Survey; Carey et al. 2009; green), and ATLASGAL 870 μm (see Sect. 2.2.4; red). Positions of the H II regions as listed in Anderson et al. (2011) are shown with the “×” symbols. The “+” symbol shows the position of IRAS 17043−4027. It should be noted here that a few pixels toward the central part of the 24 μm emission associated with G346.077−0.056 are saturated.
Current usage metrics show cumulative count of Article Views (full-text article views including HTML views, PDF and ePub downloads, according to the available data) and Abstracts Views on Vision4Press platform.
Data correspond to usage on the plateform after 2015. The current usage metrics is available 48-96 hours after online publication and is updated daily on week days.
Initial download of the metrics may take a while.