Fig. 4
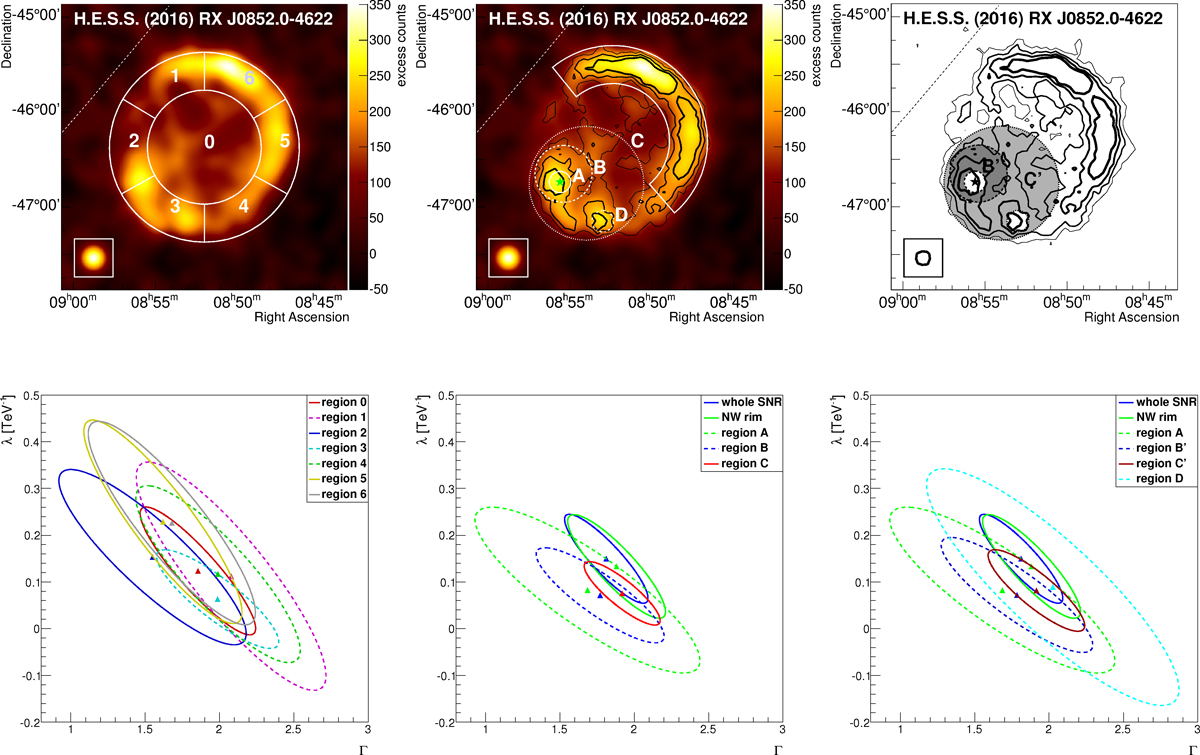
Top figures represent skymaps (smoothed exposure-corrected excess map from Fig. 1 for the top left and center pads, significance contour map for the right pad) together with various regions used for the study of the spatially resolved spectroscopy of the RX J0852.0−4622 region. Top left: regions 0 for the central part of the SNR and 1–6 for the shell are shown in white. Center: regions A, B, and C around PSR J0855−4644, region D around the southern enhancement in the azimuthal profile, and the region used for the NW rim are shown in white. The H.E.S.S. significance contours at 5, 7, and 9σ are shown in black with increasing line width for increasing significance. The position of PSR J0855−4644 is denoted by the green star. Top right: regions B′ (dark gray shaded area) and C′ (light gray shaded area) around PSR J0855−4644 are shown. The H.E.S.S. significance contours at 3, 5, 7, and 9σ are shown in black with increasing line width for increasing significance. The position of PSR J0855−4644 is denoted by the black star. Bottom figures represent the error contour plots of λ = 1∕Ecut vs. Γ for the spectra of the regions in the excess maps assuming a power law with exponential cutoff model. For each region, the fitted value is indicated with a triangle, while the ellipse indicates the contour of the 3σ confidence level statistical uncertainty. Dashed lines are used for the regions where the cutoff significance is below 3σ. Bottom left: spectra of the regions 0 to 6 are represented. Bottom center: spectra of the regions A, B, and C are represented. In addition, the contours of the analysis of the whole SNR and NW rim are shown. Since the spectra of regions A–C are correlated because the regions overlap, the corresponding contours are not meant to be compared to each other, but to the contours of the NW rim. Bottom right: spectra of the regions A, B′ , C′ , and D are represented. In addition, the contours of the analysis of the whole SNR and the NW rim are shown.
Current usage metrics show cumulative count of Article Views (full-text article views including HTML views, PDF and ePub downloads, according to the available data) and Abstracts Views on Vision4Press platform.
Data correspond to usage on the plateform after 2015. The current usage metrics is available 48-96 hours after online publication and is updated daily on week days.
Initial download of the metrics may take a while.