Fig. 2
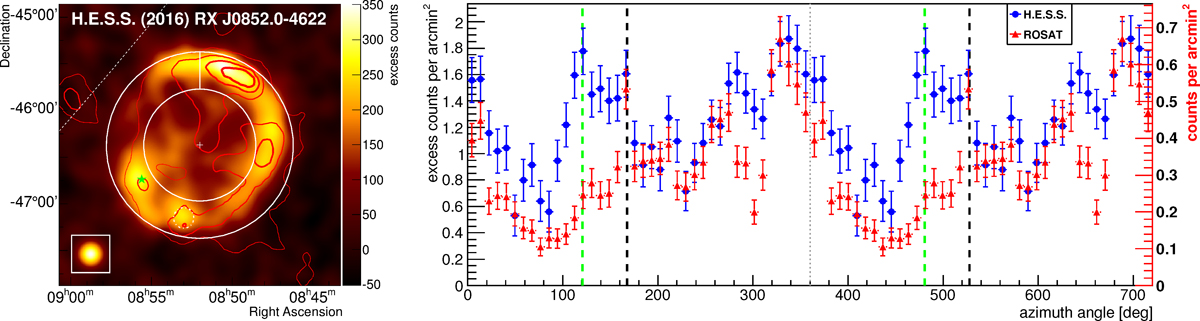
Left: smoothed and exposure-corrected excess map with ROSAT X-ray contours, as in Fig. 1. The white annulus denotes the region used for extraction of the azimuthal profile; the white vertical line denotes the origin of the azimuthal angle (north), which increases in the counterclockwise direction. The green star indicates the position of PSR J0855−4644. The white dot-dashed line indicates a point-like region around the position of the southern enhancement. Right: azimuthal profile extracted from the annulus in the skymap on the left panel is shown in blue for the H.E.S.S. γ-ray data (left scale) and in red for the ROSAT X-ray data (right scale). For better visibility, two periods separated by a dashed gray line are shown. The azimuthal position of PSR J0855−4644 and the center of the region around the southern enhancement are indicated by green and black vertical dashed lines, respectively. The vertical error bars represent 1σ statistical uncertainties; the horizontal bars represent the bin widths.
Current usage metrics show cumulative count of Article Views (full-text article views including HTML views, PDF and ePub downloads, according to the available data) and Abstracts Views on Vision4Press platform.
Data correspond to usage on the plateform after 2015. The current usage metrics is available 48-96 hours after online publication and is updated daily on week days.
Initial download of the metrics may take a while.