Fig. 1

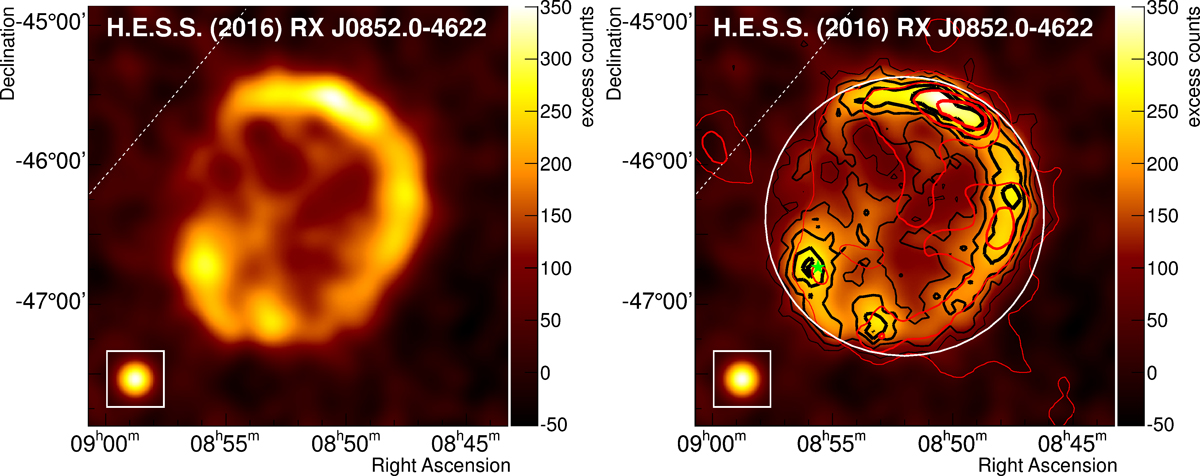
Left: exposure-corrected excess map for RX J0852.0−4622. The data were binned in bins of 0.01° on each coordinate and smoothed with a Gaussian function of width 0.08°. The white dashed line shows the position of the Galactic plane; the inset shows the PSF of the analysis at the same scale for comparison. Right: same as in the left panel, but additionally the boundary of the ON region is shown as a white circle and the significance contours at 3, 5, 7, 9, and 11σ are shown in black with increasing line width for increasing significance. In addition, X-ray contours from the ROSAT All Sky Survey for energies larger than 1.3 keV are shown in red. The X-ray data were smoothed in the same way as the γ-ray data to allow for a direct comparison. The X-ray contours were derived at 25, 50, 75, and 100 counts. The green star indicates theposition of PSR J0855−4644.
Current usage metrics show cumulative count of Article Views (full-text article views including HTML views, PDF and ePub downloads, according to the available data) and Abstracts Views on Vision4Press platform.
Data correspond to usage on the plateform after 2015. The current usage metrics is available 48-96 hours after online publication and is updated daily on week days.
Initial download of the metrics may take a while.


