[https://doi.org/10.1051/0004-6361/201525895]
[https://doi.org/10.1051/0004-6361/201525922]
Fig. 1
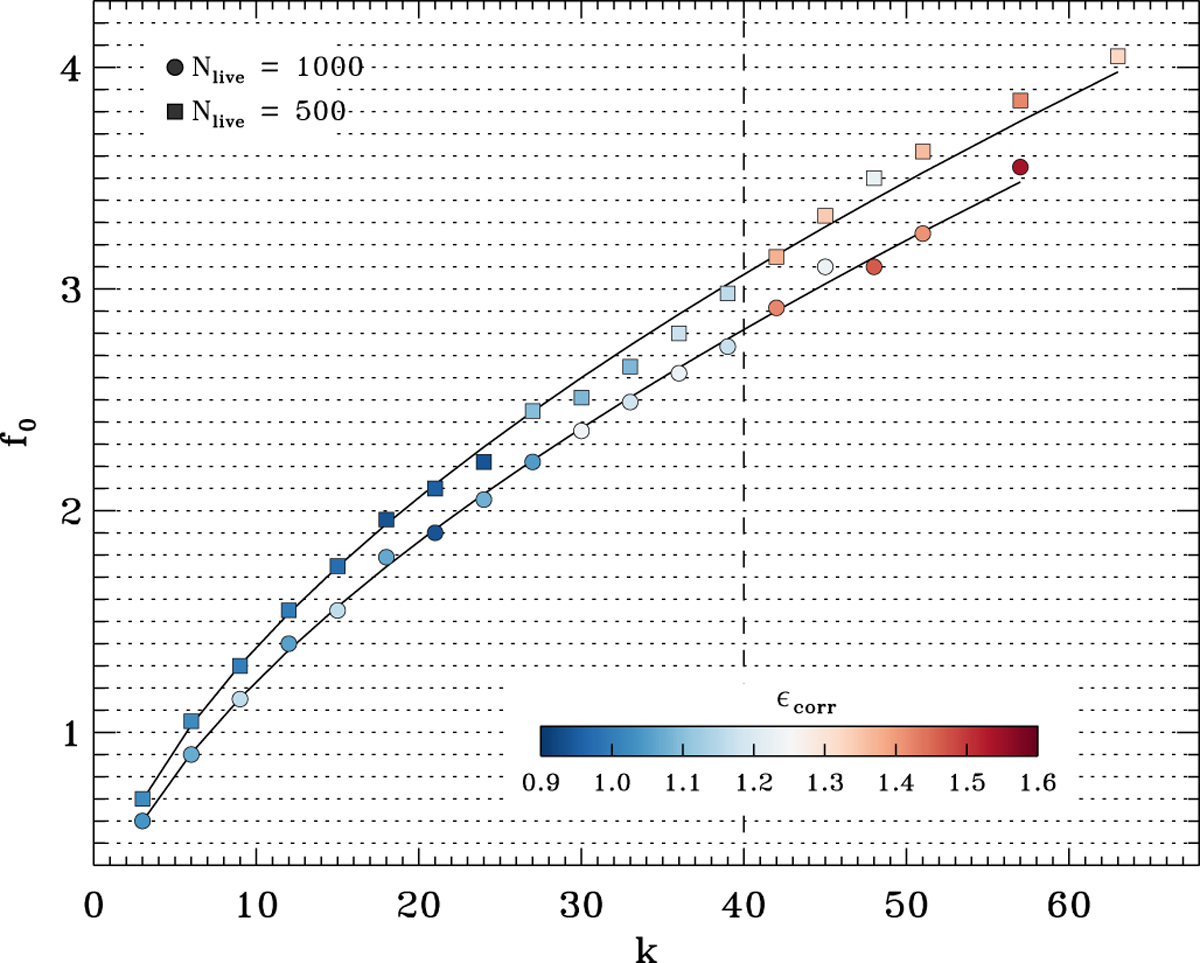
Initial enlargement fraction f0 used in DIAMONDS, as a function of the number of dimensions involved in the inference problem, k. The 37 independent computations shown in the plot (one for each symbol) are performed using a peak-bagging analysis on the test star KIC 12008916 and a number of live points of Nlive = 500 (squares) and Nlive = 1000 (circles). The color of the symbols indicates the ratio ϵcorr between the theoretical (Eq. 3) and computed error (the latter obtained from the Bayesian inference performed with DIAMONDS) on the ℓ = 0 mode frequencies involved in the fit. For ϵcorr = 1 we have perfect agreement between predicted and computed errors. The dashed vertical line delimits a transition to a high-dimensional regime in which the calibration of f0 becomes more critical and the computed errors can be underestimated with respect to the prediction by more than 30%.
Current usage metrics show cumulative count of Article Views (full-text article views including HTML views, PDF and ePub downloads, according to the available data) and Abstracts Views on Vision4Press platform.
Data correspond to usage on the plateform after 2015. The current usage metrics is available 48-96 hours after online publication and is updated daily on week days.
Initial download of the metrics may take a while.