Free Access
Fig. 1
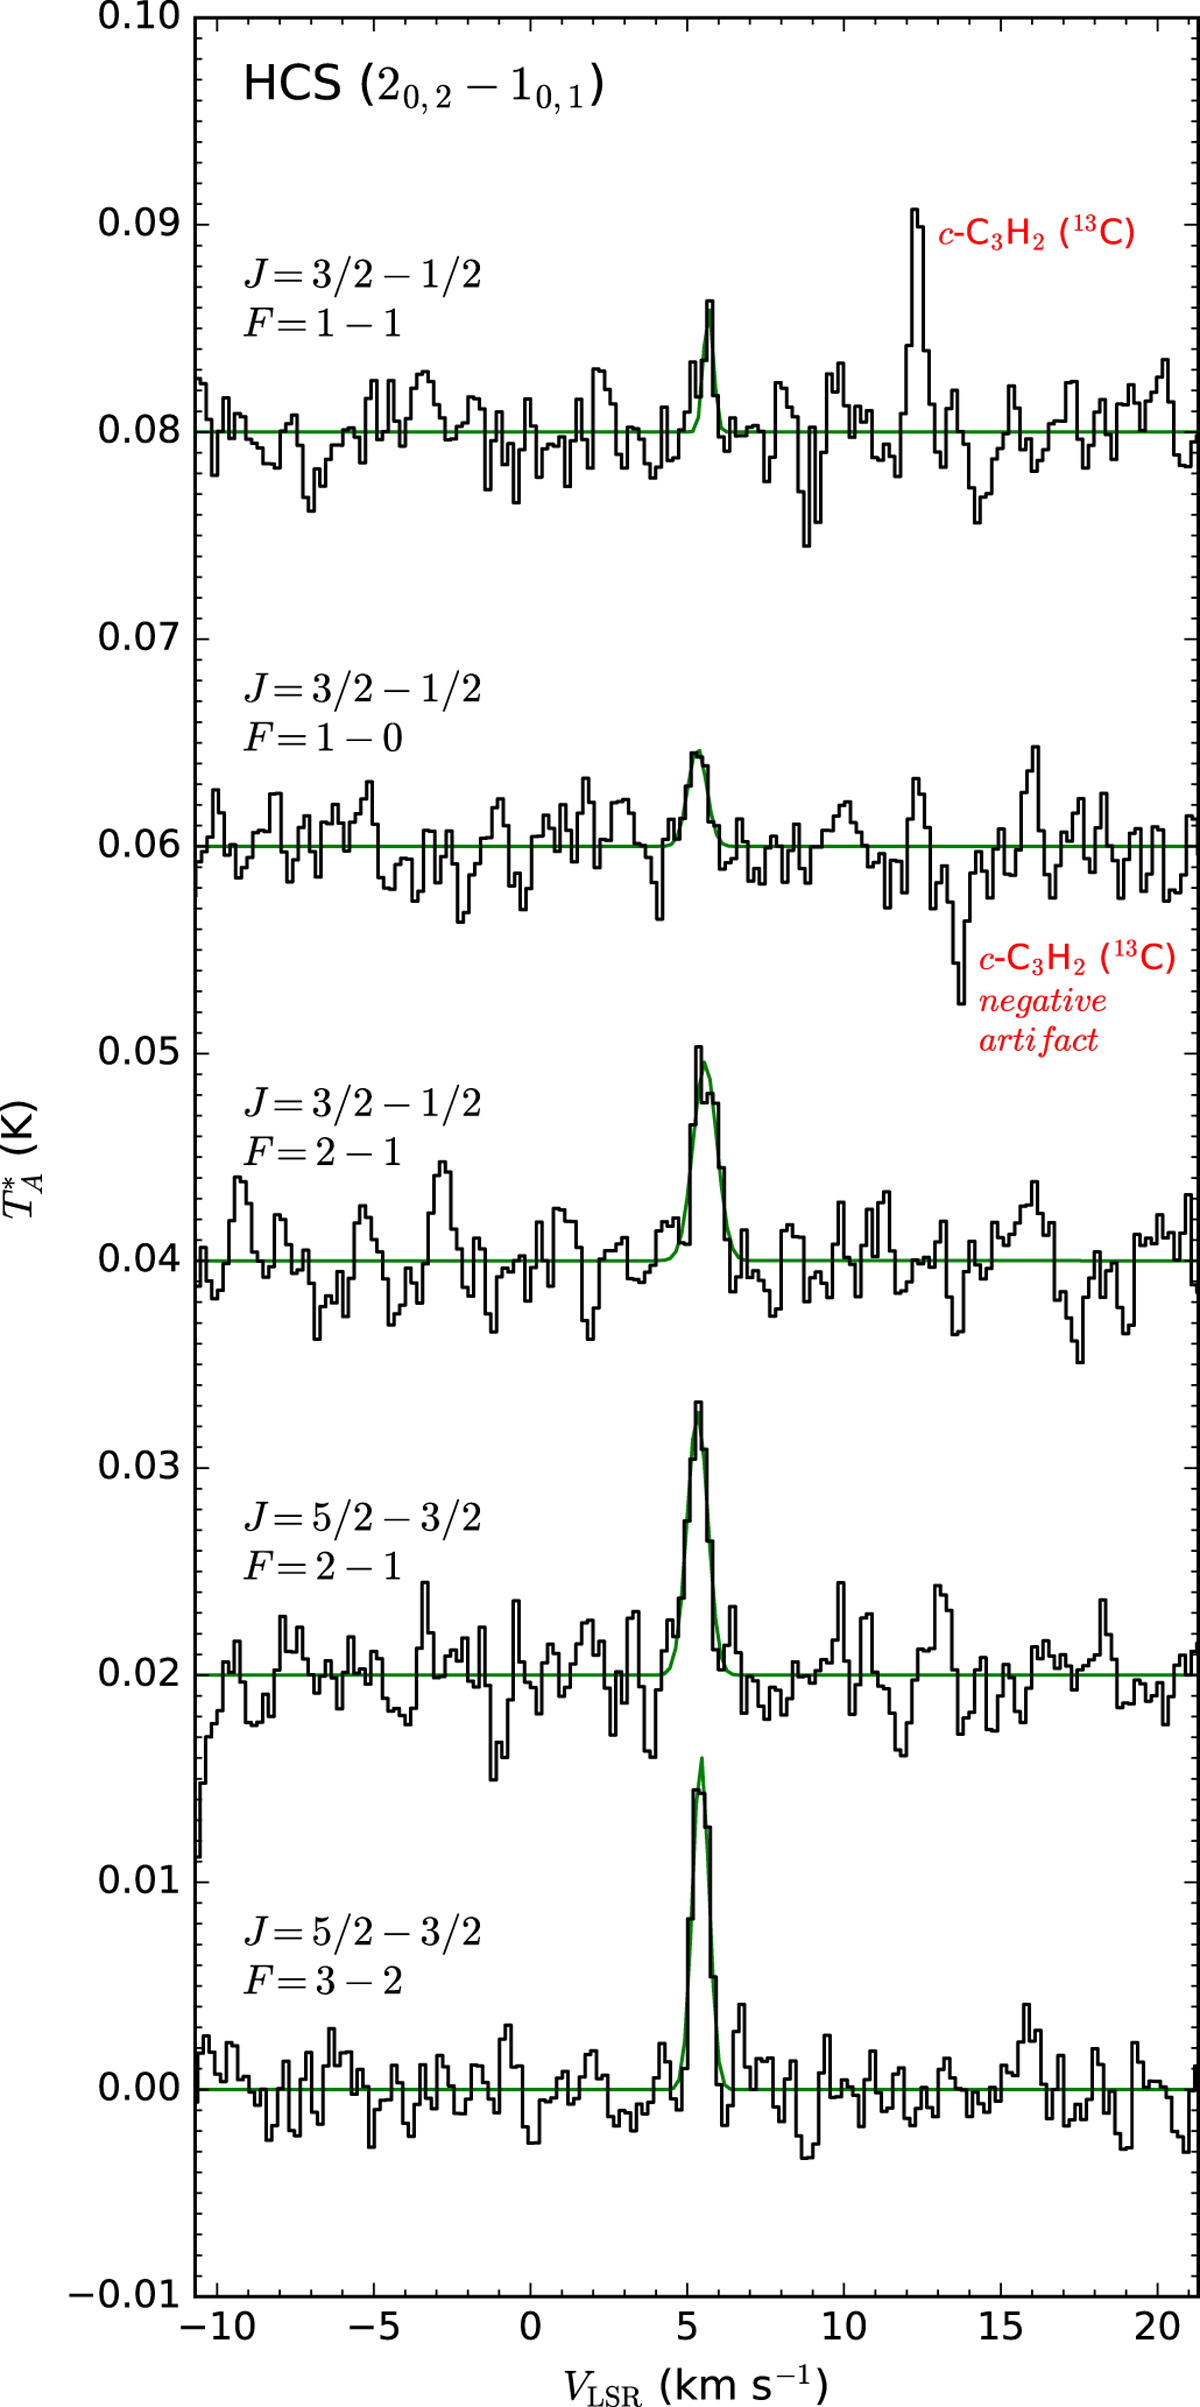
Linesof HCS observed in L483 are shown from bottom to top in order of increasing frequency. Note that the observed line intensity decreases as the frequency increases.
Current usage metrics show cumulative count of Article Views (full-text article views including HTML views, PDF and ePub downloads, according to the available data) and Abstracts Views on Vision4Press platform.
Data correspond to usage on the plateform after 2015. The current usage metrics is available 48-96 hours after online publication and is updated daily on week days.
Initial download of the metrics may take a while.