Fig. B.5
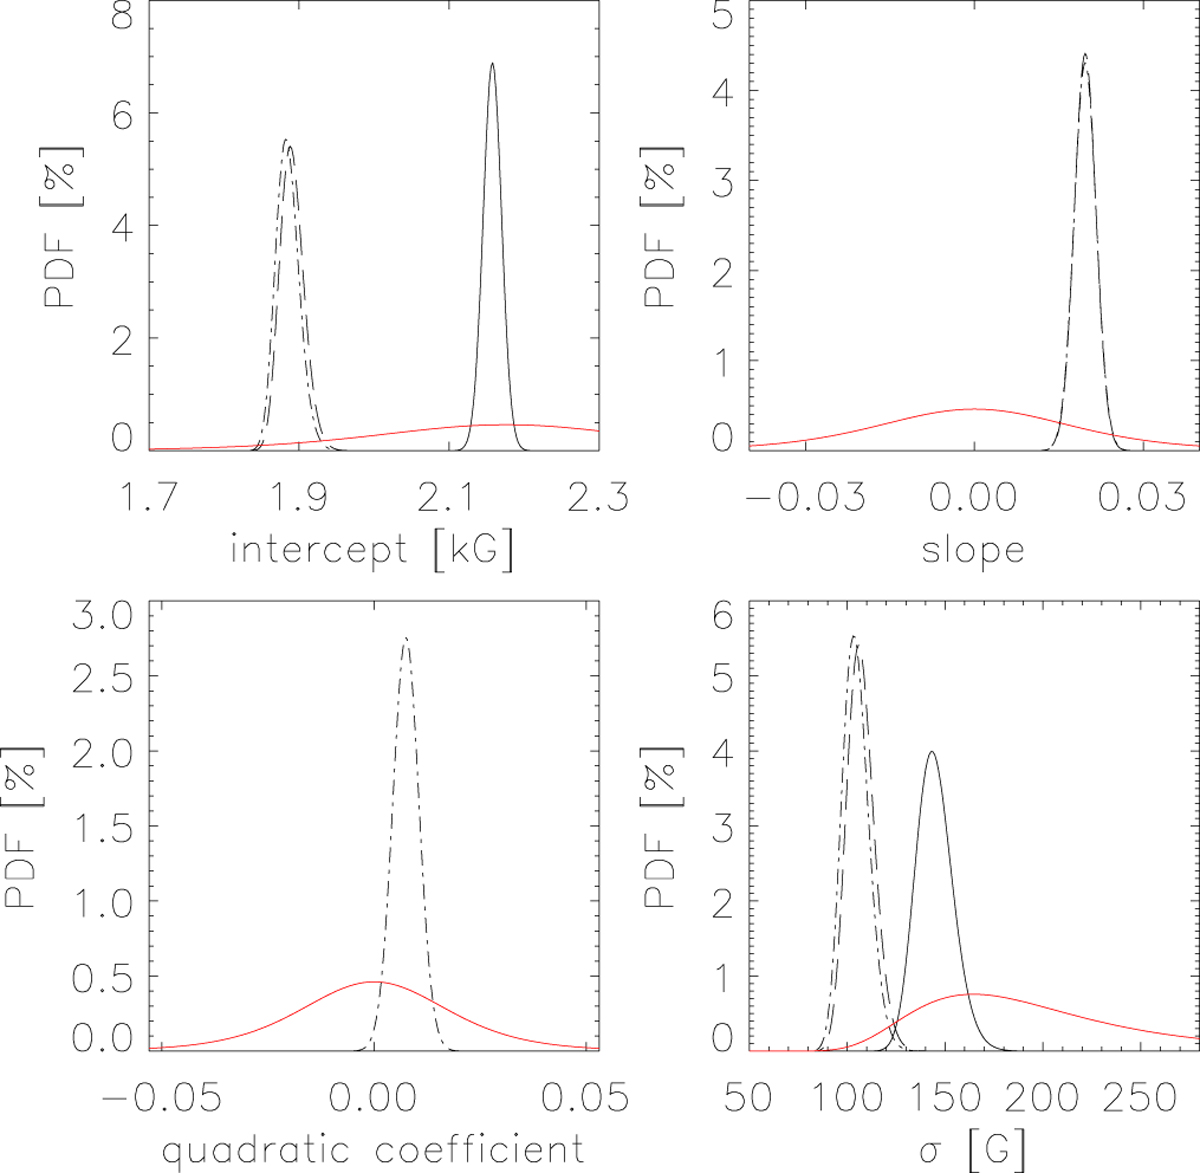
Prior (red lines) and posterior (black lines) distributions of the regression coefficients and standard deviation of the error distribution for the dependence of magnetic field inclination on the logarithm of the area. The solid lines correspond to the constant model, the dashed lines to the linear model, and the dash-dotted lines to the quadratic model.
Current usage metrics show cumulative count of Article Views (full-text article views including HTML views, PDF and ePub downloads, according to the available data) and Abstracts Views on Vision4Press platform.
Data correspond to usage on the plateform after 2015. The current usage metrics is available 48-96 hours after online publication and is updated daily on week days.
Initial download of the metrics may take a while.