Fig. B.1
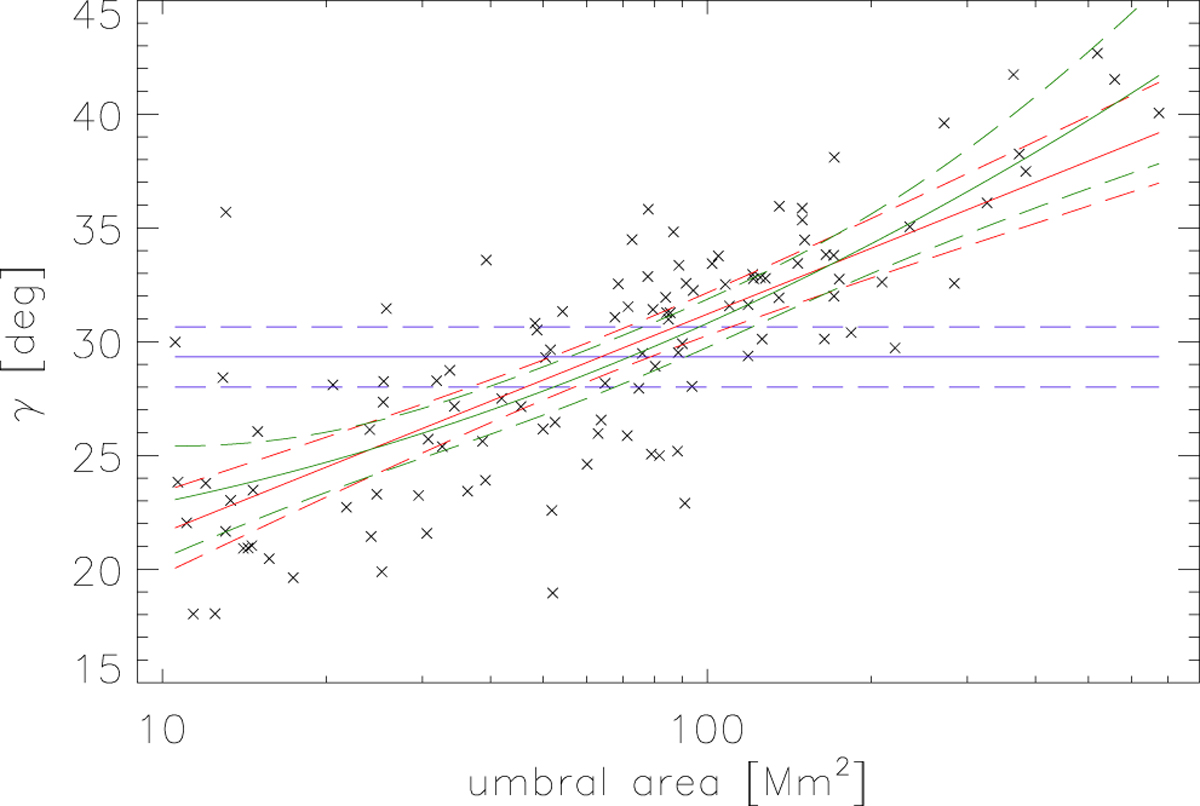
Scatter plot showing the dependence of magnetic field inclination on the umbra area. A black cross marks the observed data points. The line colour denotes the model complexity of the Bayesian linear regression; blue shows a constant model, red a linear model, and green a quadratic model. The solid lines mark the most probable value estimated by the corresponding model, and the dashed lines mark the 99% confidence interval of the estimated model.
Current usage metrics show cumulative count of Article Views (full-text article views including HTML views, PDF and ePub downloads, according to the available data) and Abstracts Views on Vision4Press platform.
Data correspond to usage on the plateform after 2015. The current usage metrics is available 48-96 hours after online publication and is updated daily on week days.
Initial download of the metrics may take a while.