Fig. A.1
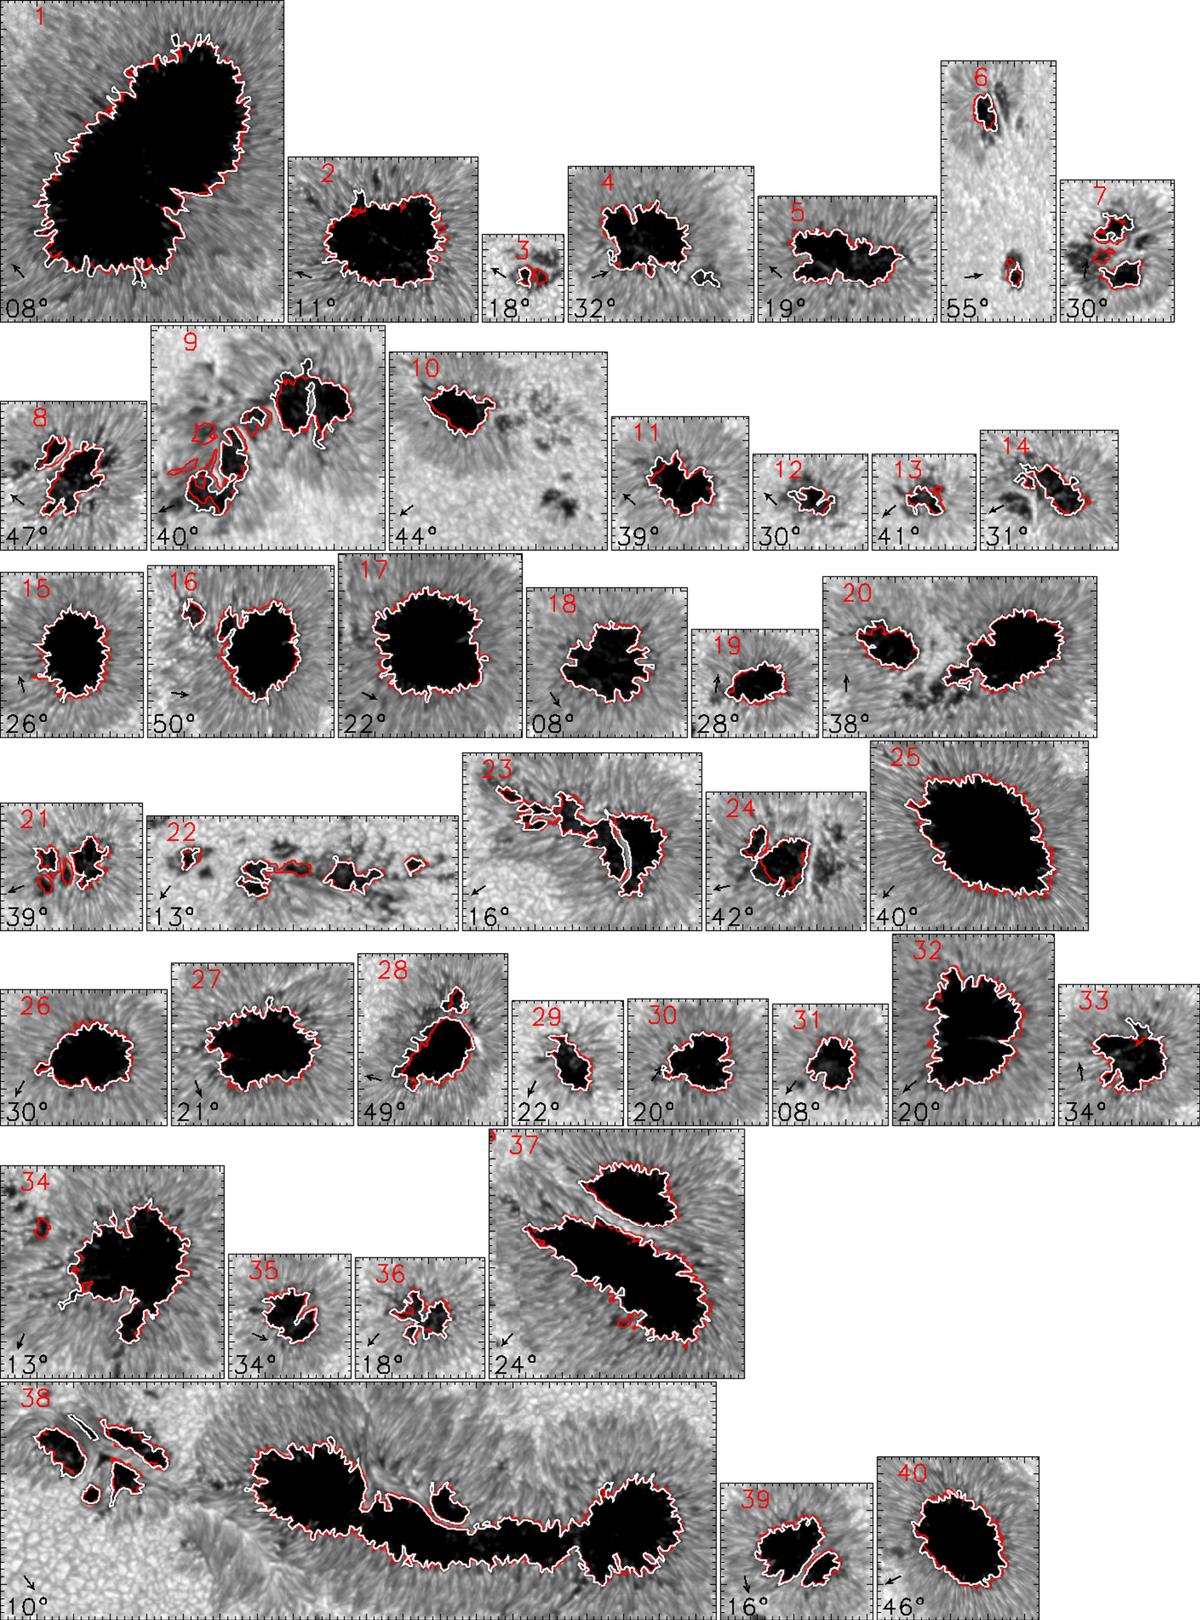
Hinode SP maps. The spatial scale in all panels is the same, with one tick mark of the axis being 1′′. The white contours mark the intensity threshold of 50% of the quiet-Sun intensity. The red contours are independently defined and outline the isocontours of 1867 G of Bver. Only contours encircling regions larger than 3 Mm2 are shown. The arrows point to the disc centre. The black numbers denote the heliocentric angle of the sunspot. The red numbers refer to the scan number as listed in Table A.1.
Current usage metrics show cumulative count of Article Views (full-text article views including HTML views, PDF and ePub downloads, according to the available data) and Abstracts Views on Vision4Press platform.
Data correspond to usage on the plateform after 2015. The current usage metrics is available 48-96 hours after online publication and is updated daily on week days.
Initial download of the metrics may take a while.