Fig. 2
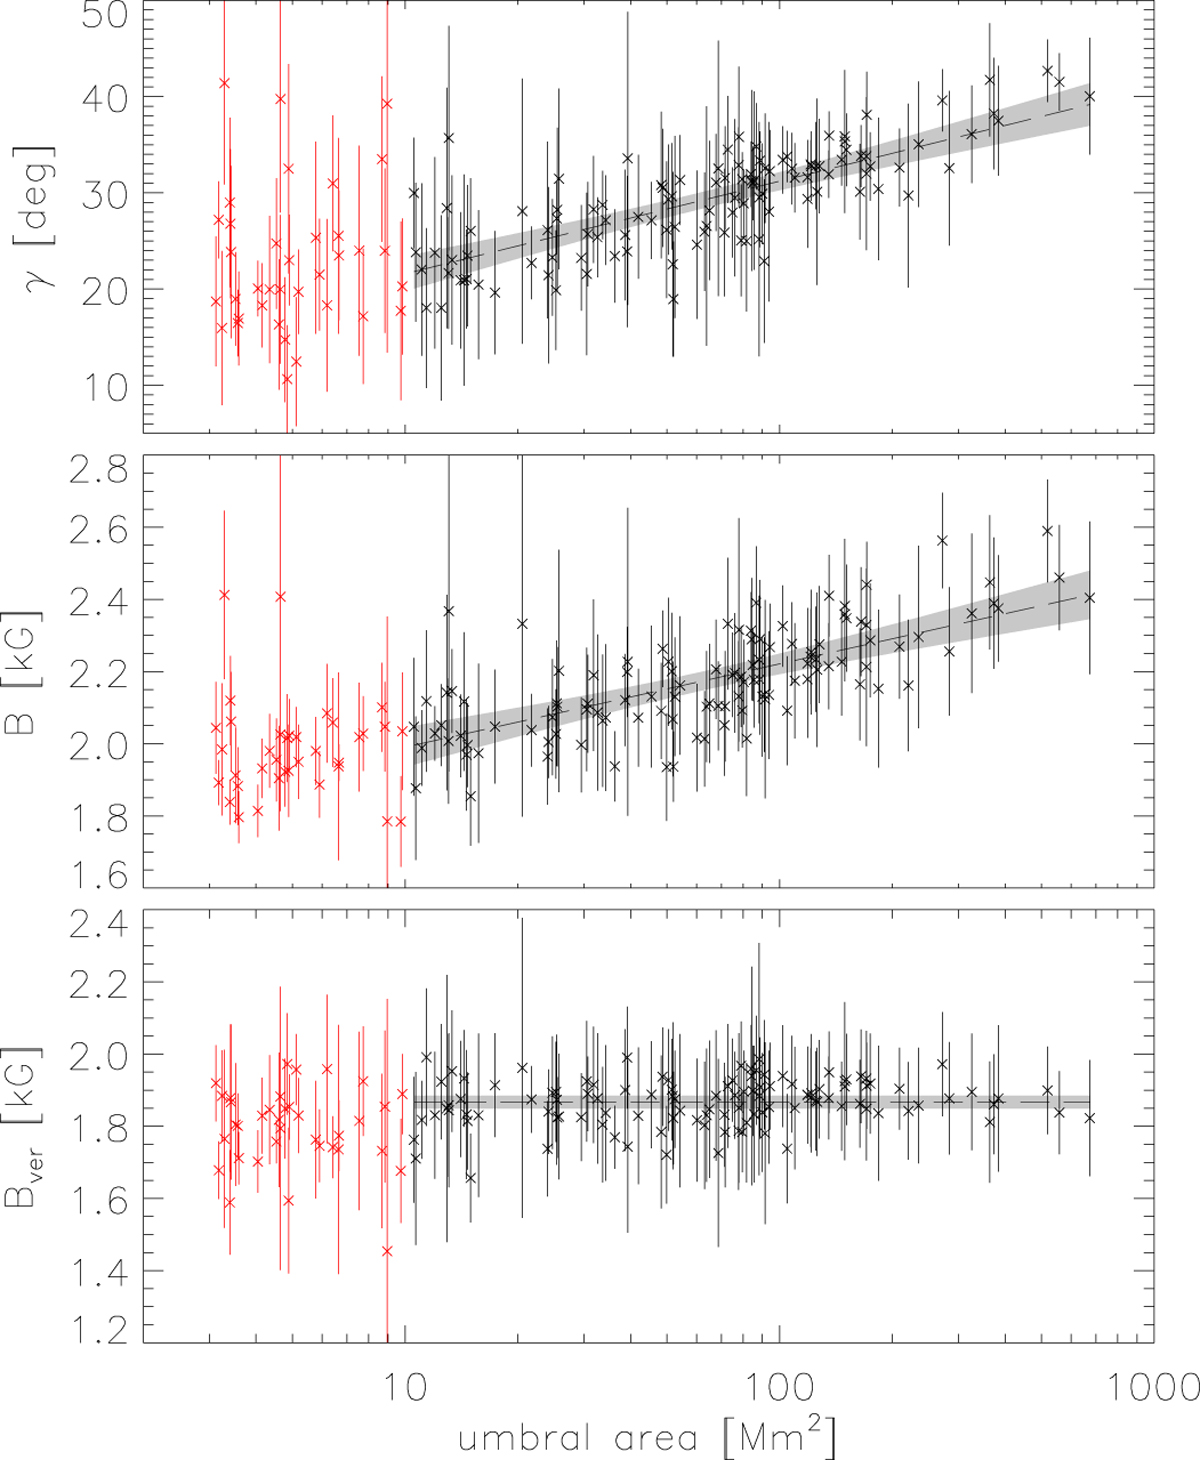
Mean values of the magnetic field inclination (A), the magnetic field strength (B), and the vertical component of the magnetic field (C) for every identified boundary as a function of the area encircled by the given boundary. The uncertainties represent the standard deviations of the physical parameters at the boundaries. Contours encircling areas smaller than 10 Mm2 marked in red are not considered for the statistical analyses. The dashed line corresponds to the most probable value estimated by a Bayesian linear regression, and the shaded area denotes the 99% confidence interval of the estimated model.
Current usage metrics show cumulative count of Article Views (full-text article views including HTML views, PDF and ePub downloads, according to the available data) and Abstracts Views on Vision4Press platform.
Data correspond to usage on the plateform after 2015. The current usage metrics is available 48-96 hours after online publication and is updated daily on week days.
Initial download of the metrics may take a while.