Fig. 1
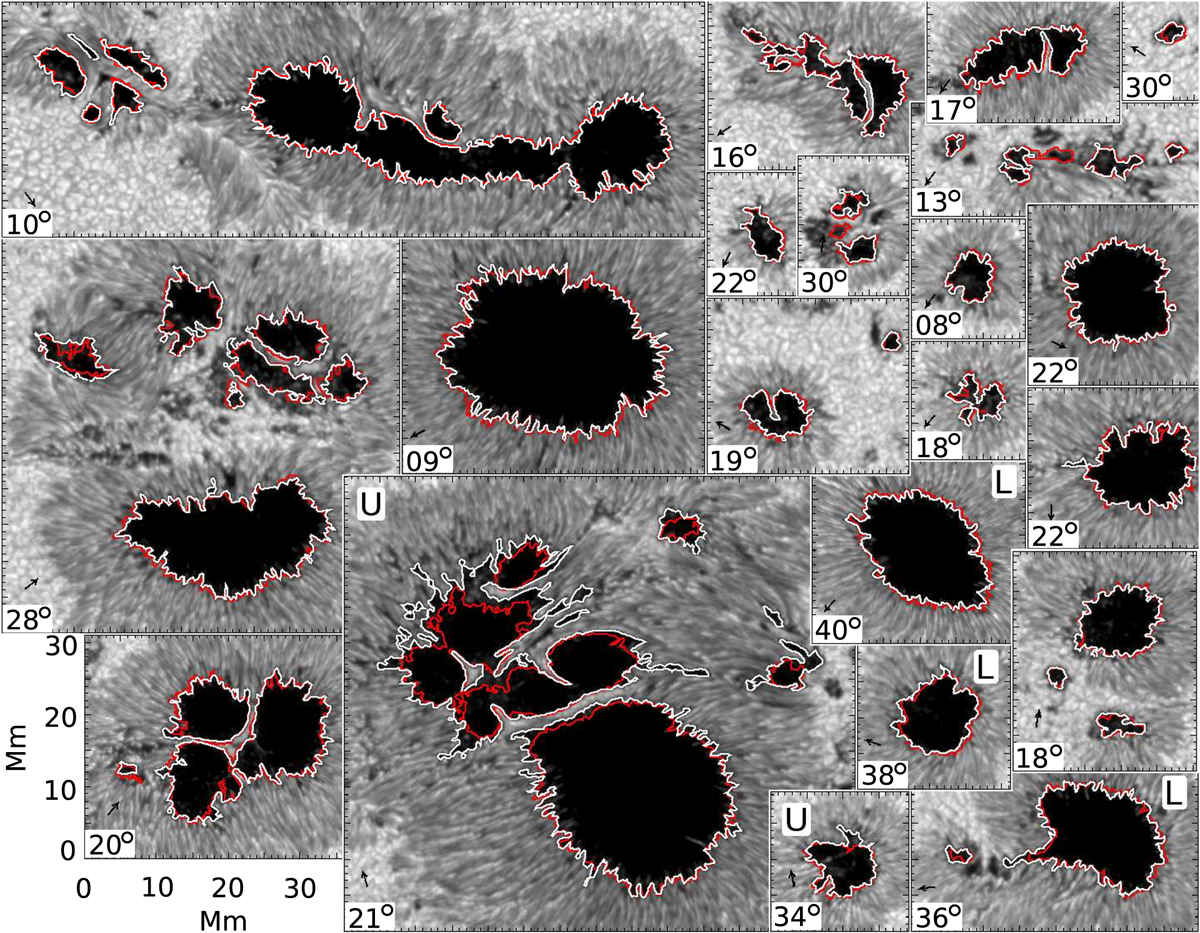
Selection of the analysed sample of sunspots displayed on the same scale. The white contours mark the intensity threshold of 50% of the quiet-Sun intensity. The red contours are independently defined and outline isocontours of 1867 G of Bver . Only contours encircling regions larger than 3 Mm2 are shown. Sunspots marked (L) clearly show a systematic displacement of the white and red contours that is due to line-of-sight effects. Sunspots marked (U) have regions where the red contours lie within the intensity (white) contours. The arrows point to the disc centre. The numbers denote the heliocentric angle of the sunspot.
Current usage metrics show cumulative count of Article Views (full-text article views including HTML views, PDF and ePub downloads, according to the available data) and Abstracts Views on Vision4Press platform.
Data correspond to usage on the plateform after 2015. The current usage metrics is available 48-96 hours after online publication and is updated daily on week days.
Initial download of the metrics may take a while.