Fig. 2
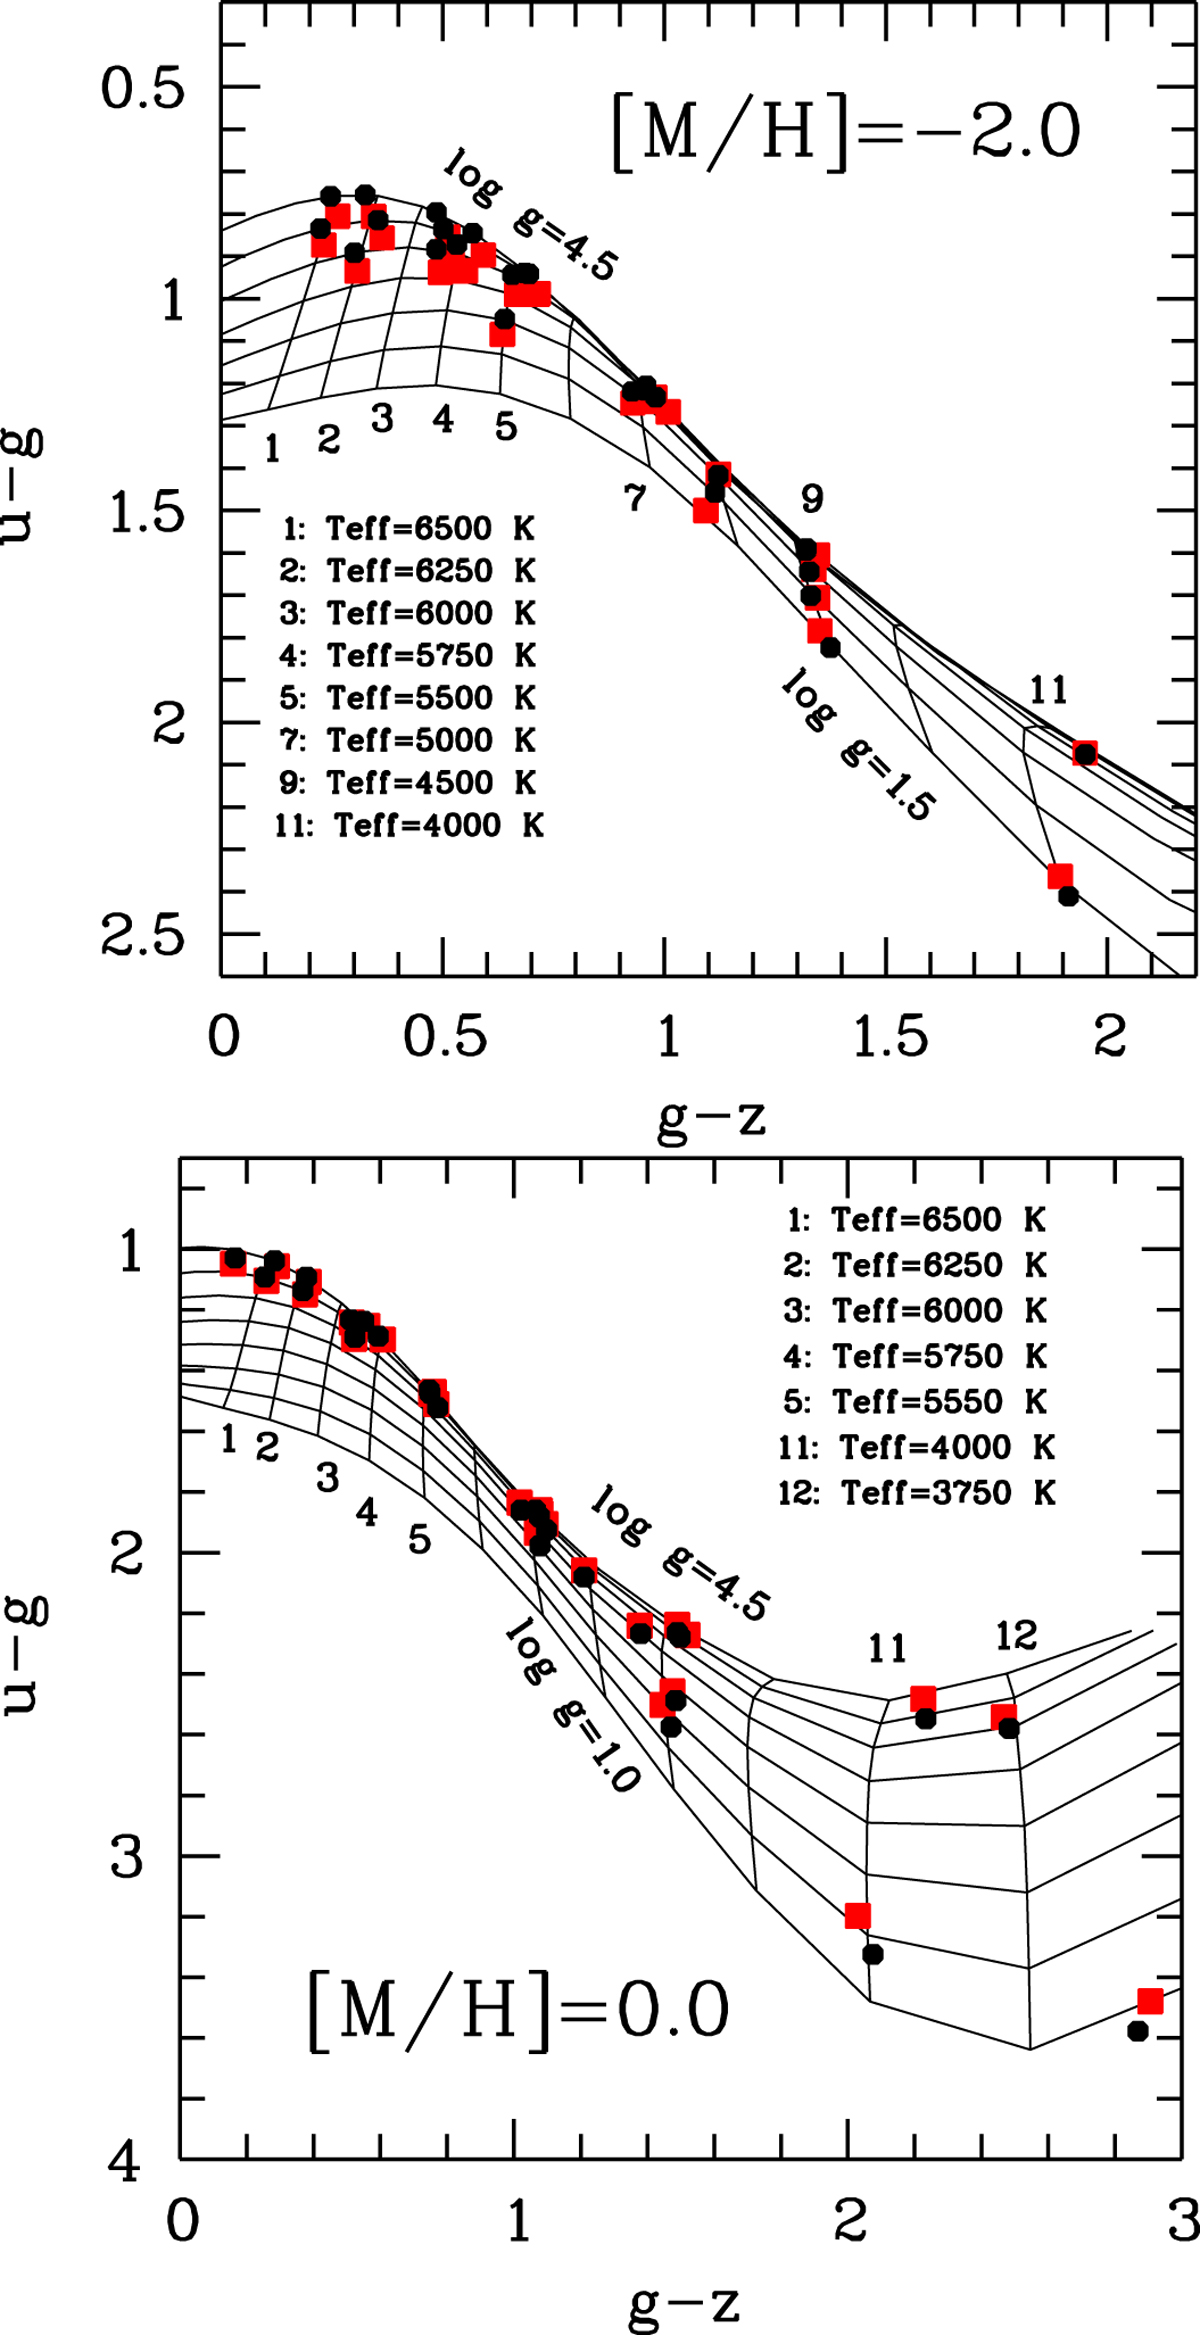
A u − g vs. g − z colour–colour diagram for solar metallicity (bottom panel) and − 2.0 (upper panel). The solid lines are the lines of constant temperature and constant surface gravity defined by the Castelli & Kurucz (2003) grid. The black dots correspond to our ATLAS models, that sample points within the Castelli & Kurucz (2003) grid that correspond to the parameters of the models in the CIFIST grid. The Castelli & Kurucz (2003) grid has steps of 250 K in Teff and 0.5 dex in logg. The red squares are the “3D-corrected” colours.
Current usage metrics show cumulative count of Article Views (full-text article views including HTML views, PDF and ePub downloads, according to the available data) and Abstracts Views on Vision4Press platform.
Data correspond to usage on the plateform after 2015. The current usage metrics is available 48-96 hours after online publication and is updated daily on week days.
Initial download of the metrics may take a while.