Fig. 9
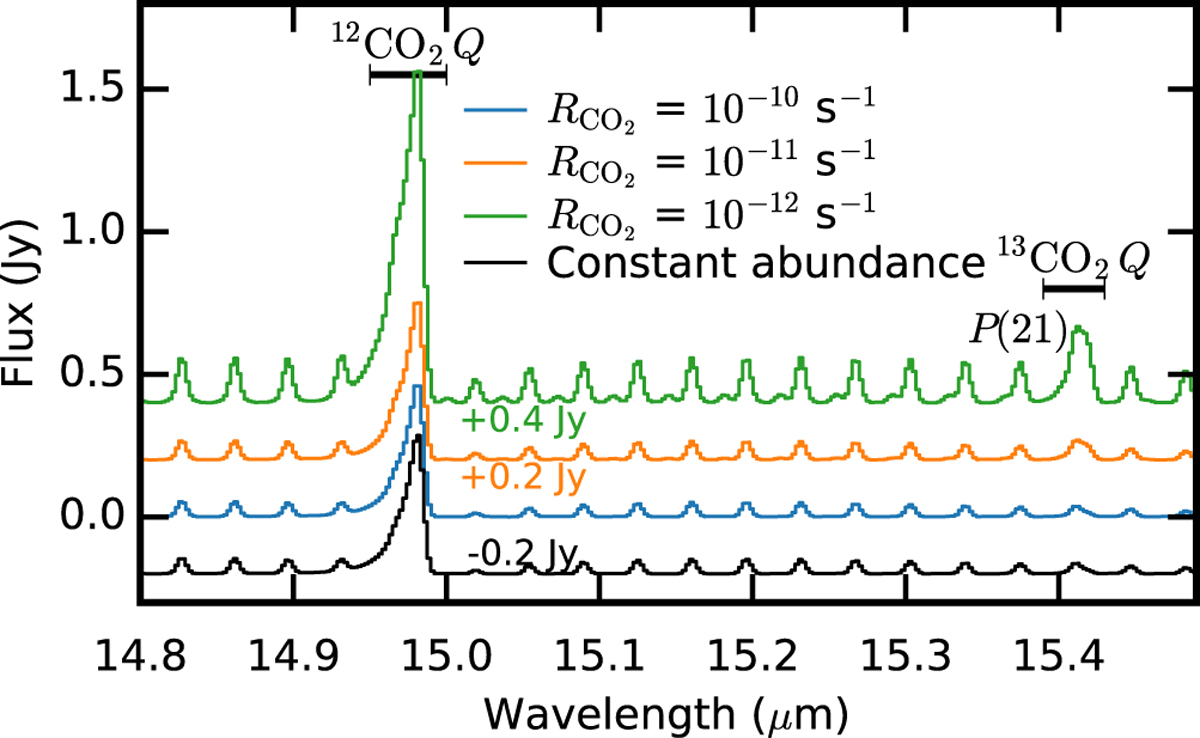
Spectra 12CO2 and 13 CO2 for models with different destruction rates at a spectral resolving power R = 2200 appropriate for JWST-MIRI. The abundance floor is taken to be 10−8. The black line shows the model results for a constant abundance as used in Bosman et al. (2017). The regions were the Q-branch flux is extracted is shown in the black lines. The 13CO2 Q-branch is blended with the 12CO2 P(23) line. The neighbouring P(21) line is indicated. Note that the models with destruction rates of 10−11 and 10−10 s−1 are indistinguishable in their 12CO2 spectra.
Current usage metrics show cumulative count of Article Views (full-text article views including HTML views, PDF and ePub downloads, according to the available data) and Abstracts Views on Vision4Press platform.
Data correspond to usage on the plateform after 2015. The current usage metrics is available 48-96 hours after online publication and is updated daily on week days.
Initial download of the metrics may take a while.