Free Access
Fig. 8
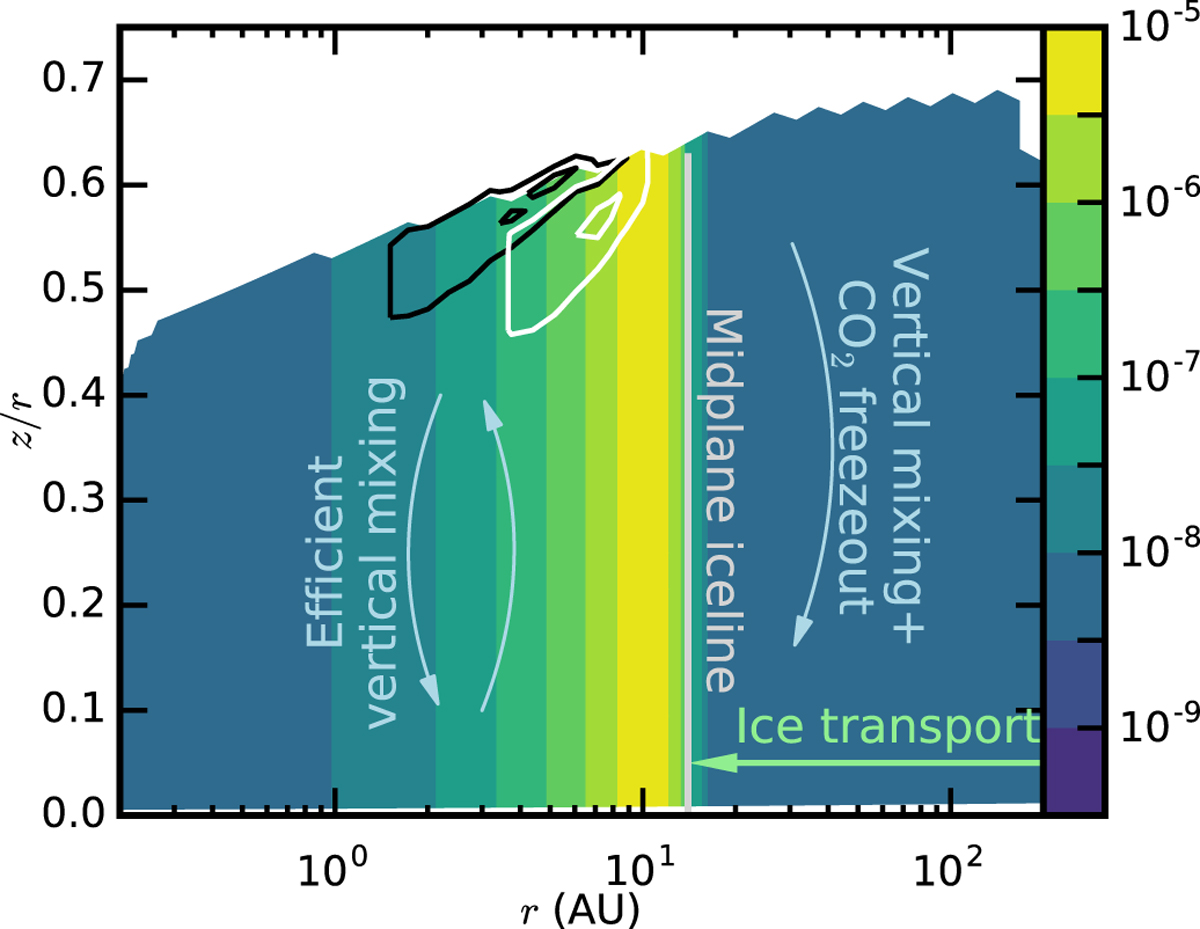
2D CO2
abundance distribution from the ![]() model with an abundance floor of 10−9.
Black and white lines show the regions where 25% and 75% of the emission of respectively
12 CO 2
and 13 CO2
is emitted from. The 13CO2
emission is more concentrated around the region with the abundance enhancement.
model with an abundance floor of 10−9.
Black and white lines show the regions where 25% and 75% of the emission of respectively
12 CO 2
and 13 CO2
is emitted from. The 13CO2
emission is more concentrated around the region with the abundance enhancement.
Current usage metrics show cumulative count of Article Views (full-text article views including HTML views, PDF and ePub downloads, according to the available data) and Abstracts Views on Vision4Press platform.
Data correspond to usage on the plateform after 2015. The current usage metrics is available 48-96 hours after online publication and is updated daily on week days.
Initial download of the metrics may take a while.